Fishing
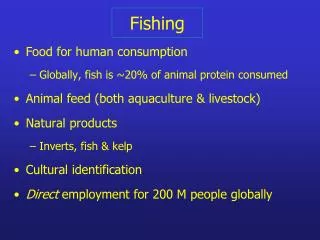
Fishing. World Dependence on Fish. Fish account for 15% of world protein supply One billion people rely on fish as their main source of animal proteins Dependence on fish is higher in coastal areas Some small island nations depend on fish almost exclusively


Fishing
E N D
Presentation Transcript
World Dependence on Fish • Fish account for 15% of world protein supply • One billion people rely on fish as their main source of animal proteins • Dependence on fish is higher in coastal areas • Some small island nations depend on fish almost exclusively • 95 million tons of fish production are harvested directly from wild populations (salt and fresh water) • Another 35 million tons are harvested from aquaculture • Most fish are used directly for food – although increasingly fish provide animals feeds etc • 35 million people are directly employed in fishing • International trade in fish products was $US 55 billion which is greater than the individual gross domestic product of over 70% of the world’s nations [Food and Agriculture Organisation of the United Nations (2002)]
Major depletion of world fish stocks • A recent paper in PLOS Biology reviews some of the current problems with the fishing industry and fish stocks around the world [Gewin (2004)]Key points cited in the paper include: A recent Food and Agriculture Organisation (FAO) states that: “28% of global [fish] stocks are significantly depleted or overexploited, and 47% are either fully exploited or meet the target maximum sustainable yields. Only 24% of global [fish] stocks are either under- or moderately exploited.”
“Most of the line fish around the coast of South Africa are depleted to 5-15% of pristine levels” • “[Asian] commercial fish species have been depleted to 10-30% of what they were 30-40 years ago.” • “FAO estimates that roughly one-quarter of the marine commercial catch destined for human consumption – some 18-40 million metric tons of fish - is thrown back into the sea, a harvest catch that is never utilized or counted.”
“It is estimated that the illegal, unreported and unregulated (IUU) fisheries surpass allowed fishing quotas by 300%”. • “Even sustainable harvest rates reduce fish populations quickly. If the goal is a productive fishery, we’re automatically talking about up to a 70% decline across the board.” • Atlantic cod have declined by almost 90%“Atlantic cod in Canadian waters suffered a total population collapse and are now on Canada’s endangered species list.”
“By the time a significant declining trend has been detected by traditional catch assessments, [fish] stocks are likely to be in poor shape, if not already depleted.” • “The global ocean has lost more than 90% of large predatory fishes, such as marlin, sharks and rays.” • “Based on the available information, it is not unusual for fish populations to show little or no recovery even after 15 years [after exploitation ceases].”
“ In the case of Antarctic species, some overexploited populations remain at less than 5% pre-exploitation abundance after 30 years.” • The paper does however have some positive points: • “In a review of 89 studies of [Marine Protected Areas]…the average number of fish inside a reserve increases between 60% -and 150%.”
Other signs of decline • Industrialized fisheries typically reduce community biomass by 80% within 15 years of exploitation • 55 species of marine fish have lost at least part of their geographical range • 3 species of marine fish have gone extinct over the past two centuries • An analysis of 230 fish populations showed an 83% reduction from known historic levels. Researchers point out that ‘known historic levels’ often underestimates true historic population [Hutchings and Reynolds (2004)]
Historical Populations • Humans have been disturbing marine ecosystems since they first learned how to fish • There have been major changes in the structure and nature of coastal marine ecosystems over many centuries • Overfishing and ecological extinction predate and precondition modern studies on marine ecosystems and recent collapses of fish stocks etc. Jackson et al. (2001)
Historical Populations • Fisheries management based on recent data only may be misleading e.g. the earliest data on surveys on fish stocks may already be on over exploited populations • Jackson et al. (2001) suggest using historical data measured in centuries rather than decades to: • Can provide the missing baseline for future restoration efforts • Raise the possibility that many more marine ecosystems may be vulnerable to collapse in the near future Jackson et al. (2001)
Are our estimates correct?An example • In 1996, Red Snapper was put under strict management in the U.S. after overexploitation • This created an incentive to substitute less valuable fish on the Red Snapper market • A recent study showed that three-quarters of the fish sold in the United States as ‘red snapper’ belonged to another species Marko (2004) • It’s unclear where the mislabelling occurred but could cause incorrect estimates of stock size if it influences the reporting of catch data Marko (2004) • It also creates an impression among the public that there is a plentiful supply of that fish • And finally, the substituted fish may be not monitored causing a large scale but unidentified exploitation of the substitute species
Fishing Down the Food Web • The mean trophic level of commercial species declined from 1950 to 1994 • This reflects a gradual transition from: long-lived, high trophic level, piscivorous (fish eating) bottom fish toward short-lived, low trophic level invertebrates and planktivorous pelagic fish [Pauly et al. (1998)]
Fishing Down the Food Web • Large predatory fish biomass today is estimated to be only about 10% of pre-industrial levels (sharks, skates, rays, and marlin) [Myers and Worm (2003)] • These effects are most pronounced in the Northern Hemisphere • This has serious consequences for ecosystems [Pauly et al. (1998)]
Recovery from Exploitation • Various studies suggest that fish do not recover rapidly from overexploitation • Research for 90 fish stocks revealed that 15 years after collapse, 40% of gadids (haddock, cod, and flatfishes) had little, if any, recovery • Only 12% exhibited full recovery • All were clupeids (herring and related species) • attributable to earlier maturity, reduced vulnerability to incidental exploitation or bycatch, and possibly reduced probability of habitat destruction by fishing gear due to pelagic lifestyle [Hutchings (2000); Hutchings and Reynolds (2004)]
Recovery from Exploitation • It is not unusual for populations that have declined more than 60% (over 15 years) to exhibit little or no recovery as much as 15 years later [Hutchings (2000); Hutchings and Reynolds (2004)]
Problems that Prevent Recovery • slow response by managers to address depletion; • inability to reduce anthropogenic removals/mortality to zero (e.g., by-catch continues); • public/user-group perceptions that are unsupported by science that delay or alter the nature of the managerial response; • the allee effect (small population sizes lead to proportionally increased rates of predation, reduced mating success and reduced fertility); [Hutchings and Reynolds (2004)]
Problems that Prevent Recovery • reduced numbers of adults can lead to increased predation of juveniles and inter-specific competition and predation; • reduced abundance of top predators causing a shift in ecosystems that may impact recovery; • selective harvesting - the largest most successful animals are targeted whereas animals with lower fitness stay in the population. [ Hutchings and Reynolds (2004)]
Problems that Prevent Recovery The impacts of inappropriate fisheries management are illustrated by the Canadian stock of Atlantic cod – within 30 years the stock declined by 99.9% in some areas. [ Hutchings and Reynolds (2004)]
What does recovery require? • Reductions in fishing are necessary, but not always sufficient, for recovery • It is near impossible to reduce fishing mortality to zero because of bycatch • Closed fisheries must remain closed until a target level is reached -rather than being reopened at the first sign of population growth
Difficulties in detecting decline • Researchers in the North Sea investigated the statistical power to detect declines in fish stocks. • They discovered that the ability to detect a decline in fisheries with a period less than decades was low • Also the ability to detect declines that could prompt listing under the IUCN Red Lists was also low [Maxwell & Jennings (2005)]
Difficulties in detecting decline and recovery • Also at least 5-10 years of dedicated monitoring needed to tell if a population has recovered. • Conservationists cannot rely on statistical certainty to show that a population is in decline, if a decline is statistically recognizable it may be too late • This reinforces the need for the precautionary principleMaxwell and Jennings (2005)
The Role of Economics • Many global fisheries overshot their economic threshold some time in the past - i.e. that have become financially unprofitable because of: -declining fish numbers, -declining value of fish and - expense of harvesting But government subsidies have allowed fishing to continue so that the “ecological” threshold has now also been exceeded
The Role of Economics • A consequence of the subsidies is that energy efficiency is plummeting • On average, for every metric ton of fuel consumed, only 1.5 metric tons of fish are harvested. • Some fisheries are orders of magnitude worse • For example, catching a metric ton of shrimp may cost 100 metric tons of fuel.
The Role of Economics • But governments keep subsidizing large scale fishing operations and vessels, with better technology to find fish and extract • Small scale operations would be more efficient and less damaging to fish stocks and the environment • But big companies are better are lobbying governments…
Atlantic Cod Hutchings ( 2004b) • In the early 1960s, Gadus morhua extended from southeastern Labrador south to the northern half of the Grand Bank • The population numbered almost two billion breeding individuals and comprised 75% to 80% of Canada’s cod • Landings were highest at 800,000 tons in 1968 • In 1976, establishment of the EEZ (Exclusive Economic Zone) excluded foreign ships from the cod fishery and reduced total landings • Through the 1980’s, landings were 250,000 tons
Atlantic Cod • Since 1983, the population declined more than 99.9% • The primary cause for decline was over-exploitation • Significant reductions in age and size at maturity were brought on by fishery induced genetic changes - due to catches there was selective pressure for smaller faster maturing animals [Olsen et al. (2004)]
Atlantic Cod • The directed commercial fishery was closed in 1992 • The fishery remains open for individual sustenance needs under strict controls • In 2001, two out of every three cod older than 1 year were still being caught by the fishery
Atlantic Cod • Main threats to recovery include: • Directed fishing • Non-directed fishing • Bycatch • Other Threats: • Altered biological ecosystems • Changes to the magnitude and types of species interactions • Fishery-induced changes to life history
Peruvian Anchoveta Clark (1976) • After WWII, a large anchoveta (Engraulis ringens)market developed in the Peru upwelling • The anchovy catch doubled each year from 100,000 tons in 1955 to 8 million tons in 1965 • The first fishery assessment (1965) showed the stock was fully exploited • The catch was limited to this amount for the next few seasons.
Peruvian Anchoveta Clark (1976) • Later studies showed the stock could yield 10 million tons per year so the quota was raised in 1968 • By 1971, the fishery appeared to be a model of successful management • In 1972, recruitment failed and a severe El Nino event crowded the adults near the coast where they were subject to heavy fishing and the fishery collapsed
Peruvian Anchoveta • Subsequent research showed that in the Pacific, air and ocean temperatures, atmospheric carbon dioxide, fish landings, and the productivity of coastal and open ocean ecosystems have varied over periods of about 50 years. • Large-scale changes in ocean temperatures result in fluctuations between a warm sardine regime and a cool anchovy regime with each regime lasting approximately 25 years • In the 20th century, there were: • cool phases 1900 to 1925, 1950 to 1975 • warm phases 1925 to 1950, 1975 to the mid-1990s • This matches up perfectly with the collapse of the California sardine fishery in the early 1950’s [Chavez et al. (2003)]
Lessons Learned • Large-scale, naturally occurring variations must be taken into account when considering human-induced climate change and the management of ocean living resources • Sustainability requires that each system falls within its normal range of natural variation
Lessons Learned • Commercial species cannot be managed in isolation from the ecosystems that they occupy • Humans must be considered part of ecosystems and the biosphere, subject to the same natural laws and benefiting from the same supporting services as other species
Damage caused by fishing gear • Although the impacts of over-fishing are a cause for concern, damage caused by fishing gear on benthic marine species and habitats are also a major issue. • Generally mobile, bottom-fishing gears are considered to cause more habitat damage then pelagic gear. [Chuenpagdee et al. (2003)]
Damage caused by fishing gear • It is suggested that ecosystem-based fisheries management include shifting from damaging to non-damaging fishing gear types. • In cases where collateral impacts cannot be addressed by alternative fishing gears and practices, implementing closed areas is the only way to protect health ocean ecosystems and species. • It has been suggested “emphasis be given to educating both the fishing industry and the public about the importance of the ecosystem impacts of fishing and the need for ecologically friendly practices.” [Chuenpagdee et al. (2003)]
By-catch and conflict • Incidental by-catch discarded after capture (as much as ¼ the total catch = 18-40 million tons!) • Affects on predatory fishes, turtles, birds and mammals • Also as available fish stocks for human use decrease, control of natural predators causes conservation management conflicts