Download
1 / 27
280 likes | 507 Views
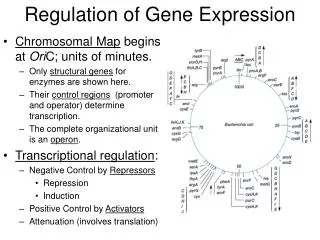
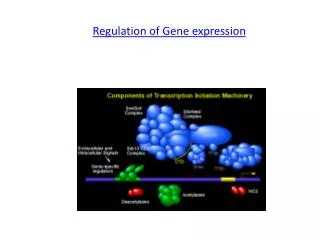
Regulation of Gene Expression in Flux Balance Models of Metabolism. Outline. Flux Balance Analysis (FBA) Introduction of the new rFBA model Examples of rFBA model. FBA. Step I: system definition Step II: obtaining reaction stoichiometries

E N D
Regulation of Gene Expression in Flux Balance Models of Metabolism
Outline • Flux Balance Analysis (FBA) • Introduction of the new rFBA model • Examples of rFBAmodel
FBA • Step I: system definition • Step II: obtaining reaction stoichiometries • Step III: set constrains and objective function • Step IV: optimization
Step I – System definition • Reactions and metabolites • Transport mechanisms and system boundary
Step II - Mass balance • Stoichiometric matrix S • Flux matrix v • Dx/dt = S · v = 0 in steadystate
Step III – Defining measurable fluxes & constraints Experimental data on flux levels, as obtained by isotope labeling or other methods, can also be used to set aior bito 0 or to another finite value to constrain the direction or magnitude of a flux.
Step IV – Optimization Define of objective function Z E.g., biomass production in defined proportion
Limitations FBA models to date have not accounted for the constraints associated with regulation of gene expression nor activity of the expressed gene product. It has been demonstrated that control of biosynthetic fluxes depends on multiple enzymes. The engineering of cell regulation is an efficient use of an organism's metabolism to produce a desired product. None of the existing models (booleanlogic, mixed integer linear optimization, fractal kinetic theory, etc) has been able to be adopted on a scale large enough to represent the entire metabolism of an organism, and thus the systemic regulatory or metabolic properties of an entire organism have yet to be analyzed.
rFBA model Adding transcriptional regulatory constrains to FBA solution space is restricted to a smaller space
Cells are subject to both invariant and adjustable constraints. Invariant constrains: Physico-chemical constrains in origin and include stoichiometric, capacity and thermodynamic constraints. They can be used to bracket the range of possible behaviors. Adjustable constraints: Biological in origin, and they can be used to further limit allowable behavior. These constraints will change in a condition-dependent manner. The transcriptional regulatory structure can be described using Booleanlogic equations, which assigns expression of a transcription unit to 1 if the transcription unit is transcribed, and 0 if it is not. Similarly, the presence of an enzyme or regulatory protein, or the presence of certain conditions inside or outside of the cell, may be expressed as 1 if the enzyme, protein, or a certain condition is present and 0 if it is not.
Boolean logic equation “AND” “OR” “NOT” Trans= IF (G) AND NOT (B) rxn= IF (A) AND (E) vrxn(t) = 0 , when E is not present at timepoint t (t1<=t<=t2) A simple regulatory circuit. Gene G is transcribed by a process trans to produce an enzyme E. This enzyme then catalyses a reaction rxn which converts substrate A into product B. Product B then represses transcription of G, leading to depletion of E.
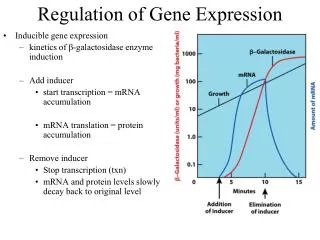
Time course of growth The experimental time is divided into small time steps, Δt. Beginning at t0where the initial conditions of the experiment are specified, the metabolic model is used to predict the optimal flux. From the transport fluxes, the extracellular concentrations are calculated in a time-dependent fashion. These concentrations are then used as the initial conditions for the next time step. t0 t1 t2 t3 t4 t5
Example 1- diauxie in two carbon sources C1 RpC1 TC2 , O2 R5b
Example 2 – Aerobic/Anaerobic diauxie Remove o2 Reo2 R5a R5b and Rres
Example 3 – Growth on carbon and Amino acid with carbon in excess H R8a, O2 R5b
Example 3 – Growth on carbon and Amino acid with carbon in excess
Example 4 – Growth on carbon and Amino acid with amino acid in excess C2 used up Rpb R2a R7
Example 4 – Growth on carbon and Amino acid with amino acid in excess
Reference • Markus W Covert, Christophe H. Schilling and Bernhard PalssonRegulation of Gene Expression in Flux Balance Models of Metabolism, J Theor Biol. 2001 Nov 7;213(1):73-88. • Flux balance analysis of biological systems: applications and challenges, karthik Raman and Nagasuma Chandra, Brief Bioinform (2009) 10 (4): 435-449. doi: 10.1093/bib/bbp011 • http://cmt.hkbu.edu.hk/colloquium/Flux%20Balance%20Analysis.ppt • Advances in flux balance analysis. K. Kauffman, P. Prakash, and J. Edwards. Current Opinion in Biotechnology 2003, 14:4910496 • Analysis of optimality in natural and perturbed metabolic networks. D. Segre et al. PNAS 2002, 99:1511-15117