Download
1 / 35
350 likes | 507 Views
The Rapid Evolution of Convection Approaching New York City and Long Island. Michael Charles and Brian A. Colle Institute for Terrestrial and Planetary Sciences SUNY at Stony Brook Secondary Author: Jeffrey Tongue NOAA/NWS Upton, NY.

E N D
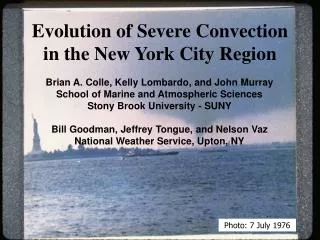
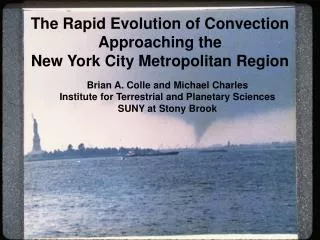
The Rapid Evolution of Convection Approaching New York City and Long Island Michael Charles and Brian A. Colle Institute for Terrestrial and Planetary Sciences SUNY at Stony Brook Secondary Author: Jeffrey Tongue NOAA/NWS Upton, NY
Probability of Detection (POD) in % – Warned events/total events(Svr tstm/torn.) ALY, BOX, OKX, and PHI Warnings from 1/1/1986 – 10/16/2003
False Alarm Rate (FAR) in % – Unverified warnings/total warnings (Svr tstm/torn.) ALY, BOX, OKX, and PHI Warnings from 1/1/1986 – 10/16/2003
Motivational Questions • What is the thunderstorm distribution over the coastal Northeast? • How do severe thunderstorms evolve as they approach the coast? • Does the evolution of severe convection change as the sea surface temperatures warm during the summer? • How well can mesoscale models forecast these convective events?
Outline • Climatology: • Severe thunderstorm/tornado reports. • Lightning climatology. • Results: • Results of lightning climatology. • Case study (18 May 2000): • Squall line evolution. • NWP model simulation of case study.
Severe thunderstorm/tornado reports per 100 km2 per 1 million peopleStorm reports from 1/1/1950 to 10/31/2002
CG Lightning Strike Data • National Lightning Detection Network (NLDN) • Global Atmospherics • CG lightning to represent convection over NE (similar to Wasula et al 2002) • June vs. August convection (2000-2002) • 5-7° C difference in sea-surface temp.
Sea Surface Temperatures 15 June 2000 15 August 2000
Case Study – 18 May 2000 Squall Line Total Storm Reports 18 May 2000 through 19 May 2000 • Total of 99 storm reports across southern New England • The only warned county that didn’t verify was Nassau county, LI. • The only damage report in Suffolk county LI was a downed tree.
.5° reflectivity loop – 20 UTC 18 May 2000 to 02 UTC 19 May 2000
Above: 21:36 UTC reflectivity indicating cross section. Top Right: Reflectivity cross section showing vertical storm structure. Right: Velocity cross section.
Left: 23:33 UTC reflectivity indicating cross section. Above: Cross section showing vertical storm structure.
18 May 2000 2100 UTC Soundings (9-hr Eta model forecast) KPOU (Poughkeepsie, NY) KOKX (Brookhaven, NY)
MM5 description • 36, 12, and 4 km domains. • Initialized with GFS at 0000 UTC 18 May 2000. • Ran 36/12 km MM5 with Grell convective parameterization, explicit only in 4 km domain.
Model Verification – Surface Temperature 1800 UTC 18 May 2000 Surface Analysis 4km MM5 (hr-18) – MSLP and T (°C)
Model Verification – Precipitation 1800 UTC 18 May 2000 Reflectivity Mosaic 12km SBU MM5 – MSLP and 1-hr precip.
Model Verification – Precipitation 2200 UTC 18 May 2000 Reflectivity 4km SBU MM5 – MSLP and 1-hr precip.
Future Work • Need to better understand the model difficulties in forecasting squall lines over the NE (MM5 rarely has them under weak to moderate CAPE; this is not an Oklahoma environment!!) • With a good simulation, one can diagnose three-dimensionally the rapid evolution of severe convection approaching the coast.
References • NLDN Details: • http://ghrc.msfc.nasa.gov/uso/readme/gai.html • Wasula, Alicia C., Bosart, Lance F., LaPenta, Kenneth D. 2002: The Influence of Terrain on the Severe Weather Distribution across Interior Eastern New York and Western New England. Weather and Forecasting: Vol. 17, No. 6, pp. 1277–1289.
Small-scale Interannual Variability June 2000 Density June 2001 Density June 2002 Density
Small-scale Interannual Variability August 2000 Density August 2001 Density August 2002 Density