Download
1 / 15
150 likes | 269 Views
This study presented by Andrew Kirk at the ITPA Pedestal Meeting in Milan examines the factors influencing H-mode access on the MAST device. Key aspects investigated include the effects of magnetic configurations, gas puff locations, divertor leg lengths, and the introduction of pellets on plasma performance. Key findings demonstrate that H-mode access is facilitated through inboard gas puffing and specific magnetic configurations. Additionally, analytical models were compared to experimental results, revealing significant insights into plasma behavior, edge temperature effects, and toroidal rotation.

E N D
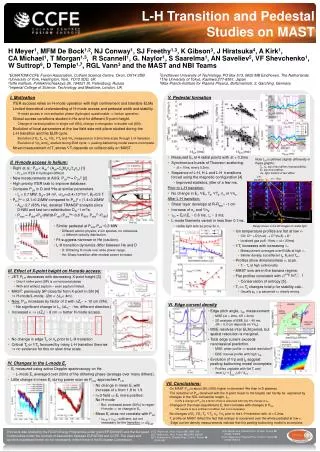
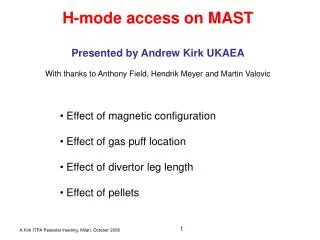
H-mode access on MAST Presented by Andrew Kirk UKAEA With thanks to Anthony Field, Hendrik Meyer and Martin Valovic • Effect of magnetic configuration • Effect of gas puff location • Effect of divertor leg length • Effect of pellets A.Kirk ITPA Pedestal meeting, Milan, October 2008
Comparison of Pthr with Ps • Pthr= 0.530.03 MW Ps=0.061ne0.62BT0.69S0.88 F.Ryter et.al., Plasma Phys. Contr. Fusion 44 (2002) A415-A421 • Pthr> 1.8 Ps (Ps = 0.29 MW) Ps=0.072ne0.7BouT0.7S0.9 (Zeff/2)0.7F(A)g T. Takizuka et.al., Plasma Phys. Contr. Fusion 46 (2004) A227-A233 • Pthr ~ Ps • Minimised by requiring: • Inboard fuelling • DND configuration. A.Kirk ITPA Pedestal meeting, Milan, October 2008
Effect of magnetic configuration • Pth reduced in DN (| rsep| < i/2) by more than factor 2 LDND: Pthr= 1.20.15 MW This effect is also observed on AUG and NSTX A.Kirk ITPA Pedestal meeting, Milan, October 2008
L-mode Possible explanations • In the L-mode phase: • No change of Te, ne or Ti for CDN, LSN, USN • DEr ~ - 1kV/m between CDN and LSN - B2SOLPS modelling also produces these changes Similar effect observed on AUG A.Kirk ITPA Pedestal meeting, Milan, October 2008
Possible explanations • In the L-mode phase: • No change of Te, ne or Ti for CDN, LSN, USN • DEr ~ - 1kV/m between CDN and LSN - B2SOLPS modelling also produces these changes • SOL Flow patterns change – similar to effects observed on C-MOD A.Kirk ITPA Pedestal meeting, Milan, October 2008
I/B O/B Effect of gas puff location H-mode access easier using Inboard Gas puff A.Kirk ITPA Pedestal meeting, Milan, October 2008
Possible explanations • HFS fuelling changes the toroidal rotation of the plasma due to • Neoclassical toroidal viscosity (P. Helander et.al.) • Flows driven by B drifts (V.A. Rozhansky et.al.) • The Rozhansky explanation predicts an Increase in toroidal flow with HFS gas puff rate A.Kirk ITPA Pedestal meeting, Milan, October 2008
Possible explanations Increase in toroidal flow with HFS gas puff rate supports flows driven by B drifts interpretation A.Kirk ITPA Pedestal meeting, Milan, October 2008
Divertor leg length • Repetitive L-mode phases induced by change of the connection length on MAST. • Loss of bootstrap current pulls leg inwards • Shortening of leg H-mode Similar effects have been observed on JET with the X-point height scan A.Kirk ITPA Pedestal meeting, Milan, October 2008
Fuelling Pellets can induce L-H transition Similar to what has been observed in DIII-D • Explained by increased density gradient due to a pellet A.Kirk ITPA Pedestal meeting, Milan, October 2008
Summary • H-mode access on MAST is facilitated near to CDN and using HFS gas fuelling. Studies have been performed trying to understand these effects • In addition the effect of • Loop voltage and Density • Error fields • Effect of co vs cntr NBI • have been studied. A.Kirk ITPA Pedestal meeting, Milan, October 2008
Backup material A.Kirk ITPA Pedestal meeting, Milan, October 2008
Possible explanations for gas puff location • HFS ionisation source drives outward parallel flow. • Net toroidal torque due to B-drift of ions. • v in counter-current direction • observed in experiment. • Radial transport of toroidal momentum from SOL. • v in co-current direction • Balance of both toroidal torques determines toroidal rotation Er A.Kirk ITPA Pedestal meeting, Milan, October 2008
B2SOLPS Toroidal Velocity Radial E-field Possible explanations for gas puff location • HFS ionisation source drives outward parallel flow. • Net toroidal torque due to B-drift of ions. • v in counter-current direction • observed in experiment. • Radial transport of toroidal momentum from SOL. • v in co-current direction • Balance of both toroidal torques determines toroidal rotation Er • Predicts an Increase in toroidal flow with HFS gas puff rate A.Kirk ITPA Pedestal meeting, Milan, October 2008
Possible explanations for shorter divertor leg B2SOLPs Modelling shows that the shorter divertor leg leads to: • Lower edge temperature results in strong reduction of V|| • More negative Er, and increased shear lower Pth(?) A.Kirk ITPA Pedestal meeting, Milan, October 2008