Download
1 / 21
210 likes | 220 Views
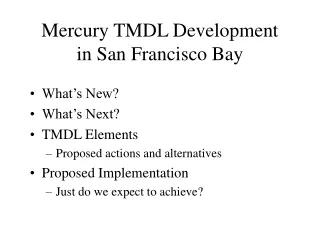
This study explores the use of multi-media monitoring to develop a statewide mercury TMDL in Minnesota, focusing on impaired waters and mercury levels in fish. The study examines mercury deposition sources, including emissions within and outside of Minnesota, and highlights the need for monitoring data to support the TMDL development process.

E N D
Use of Multi-Media Monitoring to Develop a Statewide Mercury TMDL Bruce Monson and Howard Markus Environmental Analysis & Outcomes Division Minnesota Pollution Control Agency
Waters Impaired by Mercury in Fish FCA more restrictive than 1 meal/wk for moms & kids (>0.2 ppm for a fish size class)
90 % from emission sources outside Minnesota How do we know? Mercury Deposition to Minnesota Lakes 10 % from emission sources within Minnesota
Total Mercury Deposition is Based on Sediment Cores Engstrom and Swain collecting a sediment core
Swain, Engstrom, Brigham, Henning, and Brezonik. 1992. Science 257, 784-787
1700 1750 1800 1850 1900 1950 2000 Year Sources of Atmospheric Mercury Deposition in North-Central US (Engstrom and Swain 1997 ES&T) 4X Regional North America Regional 40% 3X Natural 30% Global 30% 2X Global (Coastal Alaska) Natural mercury deposition
Atmospheric Deposition: Sediment Core Findings • ~70% current Hg deposition in MN from anthropogenic emissions (30% global + 40% regional) • Annual atmospheric deposition ~ 12.5 µg/m2 • Atm Dep peaked ~1970s in some parts of MN • Deposition now relatively uniform across state; no known fish tissue hot spots
Natural Emissions 30% Global Emissions 30% Sources of Minnesota’s Mercury Deposition Sources of Atmospheric Mercury Deposition to Minnesota Minnesota Mercury Emissions (2000) Soil roasting 0.4% Material Processing 21% Taconite processing 21% Regional Emissions 40% MN Emissions (~10%) Medical waste incineration 0.2% Coal 46% Fluorescent lamp breakage 0.9% Energy 51% Recycling mercury from products 1.4% On-site household waste incineration 2% Crematories 2% Dental preparations 3% Sewage sludge incineration 3% Smelters that recycle cars and appliances 5% Municipal solid waste combustion 5% Petroleum 5% Volatilization from disposed products 7% Wood 0.3% Purposeful Use 28% Natural gas 0.0% Source: Minnesota Pollution Control Agency March 2004
Minnesota Mercury Emissions, 1990, 1995, 2000 and Projected 2005
MPCADNR MDH DNR DNR Site Selection Fish Processing Fish Collection DNR/MDA DNR Data Reporting Chemical Analysis Fish Contaminant Monitoring Process MDH Public Health Evaluation MPCA Analysis & Research
Minnesota’s Fish Consumption Advisory Levels Applied to Fish Size Classes Population 0.2
2 0.8 0.6 0.4 0.2 40 50 60 70 80 Calculating Standard Concentration of Northern Pike Sand Point Lake 69-617 Northern Pike, 1997 Mercury Concentration (mg/kg) Fish Length, cm
Water Point Sources of Mercury – Existing, Expanding, & New • Data from about 37 facilities, averaged 5 ng/L Hg • WLA not to exceed 1% of total mercury load allocation [11 kg/yr] • In 1990, water point sources about 1.2% of total • New & expanding water sources can expand up to the current WLA of 11 kg/yr • Mercury minimization plan required
Summary of Monitoring Data Needed to Prepare the Statewide Mercury TMDL • Fish tissue mercury data to show spatial differences and includes data from 1988–1992 • Sediment core data sufficient to est. whole basin mercury fluxes • Wet deposition stations across the state to show uniform deposition • Wastewater effluent data to estimate WLA
Future TMDL Monitoring Needs • Fish tissue trends • Dry deposition (as well as Wet Dep) • Follow up intensive lake sediment core study • Wasteload allocation studies (upstream/downstream)
Questions? Bruce Monson Minnesota Pollution Control Agency 651-296-7605 bruce.monson@state.mn.us