Scientific Method Review
Scientific Method Review. State Standards: Investigation and Experimentation. #9 Scientific Investigation & Experimentation:

Scientific Method Review
E N D
Presentation Transcript
Scientific Method Review State Standards: Investigation and Experimentation
#9 Scientific Investigation & Experimentation: • Scientific progress is made by asking meaningful questions & conducting careful investigations. As a basis for understanding this concept and addressing the content in the other three strands, students should develop their own questions & perform investigations. • Students will:
a. Plan & conduct a scientific investigation to test a hypothesis. • b. Evaluate the accuracy & reproducibility of data. • c. Distinguish between variable & controlled parameters in a test. • d. Recognize the slope of the linear graph as the constant in the relationship y=kx & apply this principle in interpreting graphs constructed from data.
e. Construct appropriate graphs from data & develop quantitative statements about the relationships between variables. • f. Apply simple mathematic relationships to determine a missing quantity in a mathematic expression, given the two remaining terms (including speed = distance/time, density = mass/volume, force = pressure × area, volume = area × height). • g. Distinguish between linear & nonlinear relationships on a graph of data.
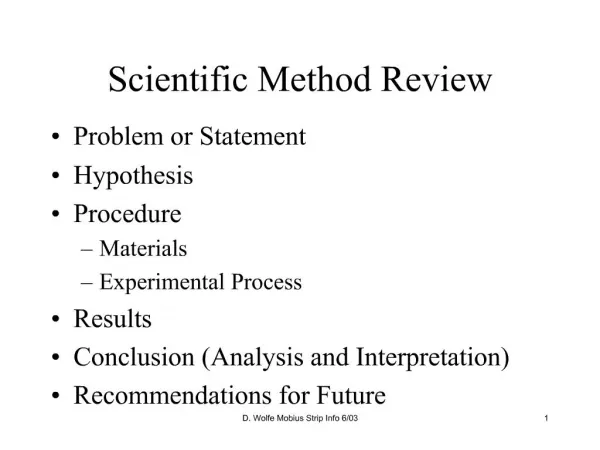
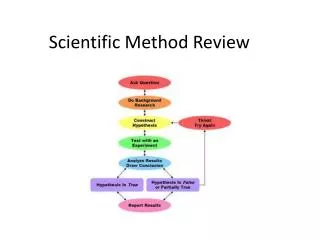
Review notes • The scientific method is a series of steps that scientists use to answer questions and solve problems. • Any information you gather through your senses is an observation. Observations often lead to questions or problems • A hypothesis is a possible explanation or answer to a question. • A good hypothesis is testable
Review notes • after you test a hypothesis, you should analyze your results and draw conclusions about whether your hypothesis was supported. • Communicating your findings (data) allows others to certify your results or continue to investigate your problem. • A scientific theory is the result of many investigations and many hypotheses that have been supported over time.
Review notes • Scientific models are representatives of objects or systems. Models make difficult concepts easier to understand. • Models can represent things too small to see or too large to observe directly • Models can be used to test hypotheses and illustrate theories
Down: 2: Scientific Method 7: law 8: meter 9: mass; 10: density 12: Kelvin 13: gram Across: 1: observation 3: area 4: data 5: variable 6: volume 11: hypothesis 14: theory Vocabulary Crossword Answers
Scientific Method • 3. F • 4. A • 5. C • 6. B • 7. E • 8. D
Math In Science • 1. a cereal box has a mass of 340g. its dimensions are 27cm x 19cm x 6 cm. what is the volume of the box?
Math In Science • 1. a cereal box has a mass of 340g. its dimensions are 27cm x 19cm x 6 cm. what is the volume of the box? • Answer: volume = 27cm x 19cm x 6cm = 3078 cm3
Math In Science • 2. Each of two cement building blocks has a volume of 2.5L. The mass of block A is 5kg, and the mass of block B is 7kg. find the difference in the densities of the two blocks (density = mass / volume) • ANSWER: • Block A: D= 5kg/2.5L = 2.0 kg/L • Block B; D= 7kg/2.5L = 2.8 kg/L • Block B is more dense than Block A; the difference is 0.8 kg/L
Variables & Controls: • 3. Imagine that you are conducting an experiment in which you are testing the effects of the height of a ramp on the speed at which a toy car goes down the ramp. • What is the variable in this experiment? • What factors must be controlled? • Answer: • The variable is the height of the ramp. • Controlled factors include the type of car, the material the ramp is made of, and the point from which the car is released.
Finding Volume: Volume (V) is the amount of space something occupies. It is expressed in cubic units such as cubic meters (m3) and cubic centimeters (cm3). Use the equations below for volume of cubes & prisms.
Math Practice:Volume= L x W x H • 1: 4 x 5 x 2= 40 cm3 • 2: 10 x 2 x 1= 20 cm3 • 3. 4 x 4 x 4= 64 cm3
smallest Displace- -ment Bottom meniscus
STANDARD 9aadditional notes: • Plan and conduct a scientific investigation to test a hypothesis
Investigation and Experimentation • Scientific inquiry refers to the different ways scientists study the natural world • Process of scientific inquiry can be broken down into several steps, including • Posing questions • Developing hypotheses – possible answer to a scientific question or an explanation for a set of observations • Designing experiments – identify the variables, factors that can change in an experiment
Investigation and Experimentation • Collecting and interpreting data – observations and measurements made in an experiment • Drawing conclusions – sums up what you have learned from an experiment • Communicating ideas and results
Sample test questionsBe sure to mark if the question is WRONGAND write the correct answer
Investigation and ExperimentationSample Test Questions 1. A student wanted to find out if changing the volume of water changes its density. Which statement is a prediction that the student could test in his investigations? A Water is not very dense B The density of water increases as its temperature increases C The density of water remains the same no matter how the volume of the sample is changed D Density equals mass divided by volume ANSWER: C
Investigation and ExperimentationSample Test Questions 2. A student conducting an experiment wants to make sure his results are reliable. What should he do? A Repeat the experiment several times and average the results B Repeat the experiment several times and use the fastest results C Repeat the experiment using a different responding variable D Repeat the experiment using a different manipulated variable ANSWER: A
STANDARD 9b • Evaluate the accuracy and reproducibility of data
Investigation and Experimentation • Making measurements and collecting data are crucial to the success of an experiment • Accuracy – how close a measurement is to the true or actual value • Reproducibility – how close a group of measurements are to each other. Data are reproducible when you repeat an experiment that has data similar to the data from previous experiments
Investigation and ExperimentationSample Test Questions 3. The actual length of a rectangular room is 6.60 meters. A student measures the length of the room three times and gets measurements of 7.49 m, 7.50 m, and 7.48 m. The student’s measurements can be described as A both accurate and reproducible B reproducible but not accurate C accurate but not reproducible D neither accurate nor reproducible ANSWER: B
STANDARD 9c • Distinguish between variable and controlled parameters in a test
Investigation and Experimentation • Parameter is a factor that can be measured in an experiment • Variable parameters change during the experiment • Manipulated variable – the parameter that is changed • Responding variable – the parameter that changes in response to the manipulated variable • Controlled parameter – not changed during experiment • Controlled experiment – only one parameter is manipulated at a time
Investigation and Experimentation • Manipulated variable: slope of ramp. You change the angle of the ramp to see how it changes the speed • Responding variable: speed. What we want to find out. The results that we measure • Controlled Parameter: same ball used for each trial
Investigation and Experimentation Responding Variable (Dependent Variable) y-axis Manipulated Variable (Independent Variable) x-axis
Investigation and ExperimentationSample Test Questions 4. Which parameter in this experiment was the responding variable (dependent variable)? a. The temperature of the water b. The location of the insulated mug c. The brand of insulated mug d. The length of time the water was allowed to cool ANSWER: A
Investigation and Experimentation 5. An experiment involves measuring the time it takes for heat to be conducted along the lengths of several bars made of different substances. The bars have the same length and the same cross-sectional area. What is the manipulated (independent) variable in this experiment? A the length of each bar B the time during which heat is conducted C the substance of which each bar is made D the cross-sectional area of each bar ANSWER: C
Investigation and Experimentation 6. A student designs a controlled experiment to test how the shape of an object affects how fast it falls when dropped. Which of the following is NOT a controlled parameter in the student’s experiment? A the shape of the object B the height from which the object is dropped C the mass of the object D the initial velocity of the object ANSWER: A
STANDARD 9d • Recognize the slope of the linear graph as the constant in the relationship y = kx and apply this principle in interpreting graphs constructed from data
Investigation and Experimentation Use the formula: • Slope is the steepness of the graph line • The slope tells you how much y (responding variable) changes for every change in x (manipulated variable) • The rise moves up the y-axis • The run moves to the right along the x-axis • The steeper the slope the greater the rate of change
Graphing and Types of Graphs 7. What information does the slope of a line on a graph provide? A how much y changes for every change in x B how much x changes for every change in y C how much the manipulated variable changes with the responding variable D how much the independent variable changes with the dependent variable ANSWER: A
Graphing and Types of Graphs 8. A scientist heated a balloon. As the balloon was heated, the gas inside expanded. The scientist measured the balloon’s size at every temperature increase of 10 degrees and then graphed the data as shown. What would be the size of the balloon if the temperature were 60°C? A 72 mL B 75 mL C 78 mL D 80 mL ANSWER: C
Graphing and Types of Graphs 9. What is the slope of the line? A 0.3°C/mL B 0.3 mL/°C C 3°C/mL D 3 mL/°C ANSWER: B
STANDARD 9e • Construct appropriate graphs from data and develop quantitative statements about the relationships between variables
Graphing and Types of Graphs Pie Charts or Circle Charts: used to display the sizes of parts that make up some whole.
Graphing and Types of Graphs • Bar Graph: used to compare the amount or frequency of occurrence of different characteristics of data. Best suited when there is a qualitative independent variable
Graphing and Types of Graphs • Line Graph: used to display data that show how one variable (the responding variable) changes in response to another variable (the manipulated variable)
Graphing and Types of Graphs 10. On a line graph, the x-axis is labeled with the name of the A manipulated variable B responding variable C controlled variable D categories being compared ANSWER: A
Graphing and Types of Graphs 11. A bar graph would be best used to graph which of the following? A showing how the mass of an object affects how fast it falls B showing how far a train travels in a certain amount of time C showing the percentage of Earth’s crust made up of iron D comparing the boiling points of different elements ANSWER: D
Graphing and Types of Graphs 12. A student collected these data while testing how the pressure of a gas changed at different temperatures. What kind of graph should the student use? A circle graph B line graph C bar graph D pie graph ANSWER: B