Download
1 / 97
970 likes | 1.09k Views
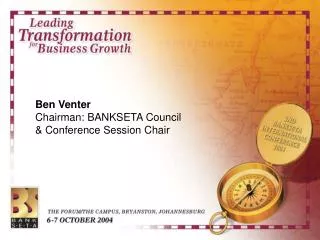
Ben Venter Chairman: BANKSETA Council & Conference Session Chair. 7 October 2004 09h00 – 09h15 Introduction 09h15 – 10h00 Minister Membathisi Mdladlana 10h00 – 11h00 Stephen Regan 11h00 – 11h30 Refreshments 11h30 – 12h15 Lindsay Falkov 12h15 – 13h00 Financial Charter Update

E N D
Ben Venter Chairman: BANKSETA Council & Conference Session Chair
7 October 2004 09h00 – 09h15 Introduction 09h15 – 10h00 Minister Membathisi Mdladlana 10h00 – 11h00 Stephen Regan 11h00 – 11h30 Refreshments 11h30 – 12h15 Lindsay Falkov 12h15 – 13h00 Financial Charter Update 13h00 – 13h30 Closing 13h30 – 14h30 Lunch
TRANSFORMATION, SKILLS DEVELOPMENT AND LEADERSHIP: A Government perspective Minister Membathisi Mdladlana Minister of Labour
LEADERSHIP AND GOVERNANCE Stephen Regan Lecturer: Cranfield School of Management United Kingdom
Leadership and Governance Innovation from Investment in Human Capital- A Turning Point for Financial Services
Themes • Crisis in Governance • Excessive focus on shareholder value • Weak leadership • Transformation • Focus on customer value • Investment in human beings
Lessons from the UK • Two and possibly three generations of retail banking • Governance is about stakeholders • Customers, Shareholders, Staff, Regulators • Type 1 • Pre competition (say pre 1990) • Regulation by eyebrows • Winners: employees, regulators, • Losers: customers, shareholders
Type II banking in the UK • Driven by competition (HSBC etc…), and technology • Contested takeovers • Scale and Consolidation • Promiscuity and churn • Acquisition vs retention models • Poor structures for dealing with this • 40million mail shots • Winners • Shareholders • Customers (a little) • Losers • Staff • What does a type II bank look like?
The Operating Model of a type II bank Savings Mortgages Consumer loans Moments of Truth Service Delivery Customer Insight Branch Call centre Contact centre Intermediaries
The problems with type II banks • “Product pipelines” push sales • But consumers cannot be separated into transactions • Channels manage (cut) costs • But there are linkages between the two • Eg driving service out of the branches • Driving sales in call centres • Type II not • A service proposition • A customer focussed proposition • What would a type III bank look like?
A Model of Leadership Vision Capability Leadership Management
Vision: Can you see it? • Managers think about doing • Reasoning from solutions back to problems • The doing drives the thinking • Task Cultures • Much management activity is about persuasion • Emotional • Rhetoric • Highly intuitive
Capability: Can you do it? • Robustness • Broadening your range of behaviours • Personal growth in this • Dialogue • The ZOUD • Maturity • Discretionary CEO type behaviour
Focussing on the Customer Who has been here before: loads of people Industry relaunchIndustry Decline Cinemas 1980s – Megaplex First Leisure, RankFashion retail multiples: Hepworths, High Street Names Next/River Island Chelsea Girl Grocery Retailers – Tesco* Fine Fare, Co-op, Sainsburys Hotels – Travelodge ThfPub venues – Wetherspoons Brent Walker, . . . Financial Retailers Big 4 Banks TK Max & Others M&SBudget Airlines Swiss Air, BA, etc 1980s 1990s 2000s
Four Ways to Value Innovate Raise Well beyond industry standardSpectrum raising New ValueProposition Eliminate Create New factors not yet thereSpectrum widening Factors no longer requiredSpectrum focusing Reduce Hygiene factorSpectrum lowering
Value Curve of Formule 1 in the French Low Budget Hotel Industry High Raise Eliminate Reduce F1 2 Star Offering Level 1 Star Low ArchitecturalAesthetics 24-hourReceptionist Room Furniture/Amenities Eating facilities Lounge Appeal Room Size Bed quality Hygiene Silence Price* Key Success Factors
Value Innovation: The Simultaneous Pursuit of Radically Superior Value and Low Cost Costs What factors should be eliminated that our industry takes for granted? What factors should be reduced well below the industry standard? What factors should be raided well above the industry standard? What factors should be created that the industry has never offered? Cost savings from eliminating & reducing Valueinnovation Cost advantagesfrom high volume Superior value by raising and creating Buyer value
But you need to continuously do it . . .Repeating Value Innovation Leverage the Product, Service andDelivery platforms over time Do this by continuously investing in knowledge – human capital
How has Compaq stayed on top of the Server industry? By following its first value innovation . . . Expandability Expandability Expandability Generalapplicationcompatibility Generalapplicationcompatibility Generalapplicationcompatibility 1989:Systempro File & printcompatibility File & printcompatibility File & printcompatibility 1993:ProLiant 1000 1992:ProSignia Performance Performance Performance Elements of product or service Elements of product or service Elements of product or service Price Price Price Reliability Reliability 1992:ProSignia Featureinnovations Configurability Configurability 1994:ProLiant 1000Rack mountable server Manageability Manageability 1993:ProLiant 1000 Storability Serviceability Featureinnovations Security Low High Low High Low High Relative Level Relative Level Relative Level
Poaching and Under-investment in Training- No excuses Pay w2 w1 Supply of labour Demand for labour after learning Demand for labour before learning Q* Labour
Determinants of Business Performance:How Strategy Contributes to the Bottom Line Value Logic:: AGENCY - lower cost capital due to strong financial management Assets Liabilities PVEA PVGO Debt Equity Value Logic: SCALE: Take out cost cross functional working Value Logic: SCOPE: Add in revenue (eg cross selling) Value Logic: LEARNING:Develop new businesses
Existing Big 4(5) Strategies Cost savings: consolidation + scale – exit definite Inertia not branding Ruthless HR Models Retention Recruitment Reward Type II HR model Financial incentives
Global Inequality • Three desiderata (UN) • Development • Economic and Social • including Life expectancy • Peace • Human Rights • Africa does much worse on these measures than other developing countries
Africa in particular • 1820-1998 Africa share of world gdp declined, much of this since 1950 • Africa from 1/3 European GDP to 1/13 • Of the decline in extreme poverty 1980 –2000 (1.5bn to 1.1bn <$1per day: none in Africa, all in China)
Participative Growth • Unaimed opulence (the market alone) • Brazil, Oman, South Africa all have much higher gdp than China or Sri Lanka but do much worse on deprivation measures • Aimed non opulence • Health and education cheap in developing countries • China’s improvement in life expectency all came before 1979 (no improvement since then)
What do you aim at? • Kerala (India) Life expectancy 70, Indian average 56/58 • Kerala has very high levels of literacy and especially female literacy • Sri Lanka: • Lower infant mortality than the US • Higher adult literacy than the US • Health and education only occurred in Europe as a result of state intervention and only a century ago
The Heart of Darkness Stylised facts are: • Resource rich, labour poor - capital intensive growth path - relative high cost labour • Small domestic markets & lumpy investments needed - public sector ownership thus normal • Rents - these are available in natural resources (imperfect global markets) - these are politicized (often ‘pleasantly’)owned taxed
The Heart of Darkness • Resource prices downturn - PSBR rises (tax take falls) - tax burden intensifies - concentration of ownership in return - twin deficits, no FDI • Economic nationalism - new nation building - expensive • Colonial legacy
HUMAN RESOURCES BENCHMARKING IN THE BANKING SECTOR Lindsay Falkov Executive Director: Resolve Group
Outline of Presentation • Introduction • Methodology • Benchmarking results • Main conclusions
Outline of Presentation • Introduction • Methodology • Benchmarking results • Main conclusions
Introduction • The purpose of the exercise was to strengthen data driven HR strategies and business alignment in the banking sector • Quantitative and qualitative data and benchmarking • Data issues: • Certain data were not sufficiently robust to use • General concerns regarding the data • Aggregate data skewed the results and limited analysis • Agreed that a good first round baseline is now in place • Focus Groups: • Encouraged dialogue on people measurement • Focused attention on internal benchmarking & measurement systems, and • Addressed the application of benchmarking results
Outline of Presentation • Introduction • Methodology • Benchmarking results • Main conclusions
MethodologyWhy Saratoga? • Saratoga human capital benchmarking measures key human resource management practices • Compare:Set performance standards for human capital management. What have others achieved? • Understandcurrent HR performance & its impacton organisational performance. What are others doing? • Strategically alignHR interventions with organisational objectives
MethodologyWhy Saratoga? Established Credibility • Saratoga Institute and Dr Jac Fitz Enz ‘founder of human performance benchmarking and assessment’ • Preeminent provider of human capital measurement and research in the world • 20 years of longitudinal data collected • Comprises 7 measurement categories: • Organisational Effectiveness • Remuneration, Compensation & Benefits • Recruitment • Absence and Retention • Training and Development • Structure of the HR Function • Occupational Health and Safety Globally Applied • Largest database of HC metrics in the world representing over 20 million employees • Represented across Europe and the United Kingdom, the United States, Brazil, Mexico, Argentina and the Southern African Development Community • Standard methodology applied worldwide, guaranteeing • Validity and integrity of data • Comparison of like with like • Private, public and parastatals
MethodologyWhy a Bank Sector Seta study? • Removed the riskassociated with a piecemeal approach • Ensured local & international comparisons • Allowed for more targeted measurement • Facilitated sector-wide analysis of results and implications • Addressed contextual factors such as: • Employment equity and scarce skills • Location with BankSeta assured individual anonymity
MethodologyResearch Focus • Sample consisted of the four largest banks • Sector compared with European & US benchmarks • Individual banks compared with sector & international benchmarks • Benchmarking supported by qualitative research • Group level data collected for the 2003 financial year • Sector reports available to all participants & results presented in consolidated form only • Banks receive own reports
MethodologyReports Sector Report • Human capital scorecards • Comparative analysis of SA & international bank sectors • Diagnosis of gaps & good practice analysis Individual Bank Reports • Human capital scorecards • Comparative analysis of individual bank, SA & international banking sectors • Diagnosis of gaps & good practice analysis
Methodology Continuous Improvement Agree basket of measures Data collection Scorecard production & verification Gap analysis & diagnostic Focus Group Final Report • The benchmarking project process
Outline of Presentation • Introduction • Methodology • Benchmarking results • Main conclusions
Main Findings • The SA banking sector’s per capita financial performance was relatively weak, while • The sector’s revenue and profit return on remuneration was comparatively high • The retail cost-to-income ratio was average, while the wholesale ratios were good on average • Average remuneration was comparatively low • Investment in training was comparatively good, though below average in relation to the management and professionals cohort • Incentive pay levels were on a par with peers • There was a strong focus on internal recruitment. One in four employees in the sector were affected, compared with an external recruitment rate of 12%
Main Findings • Resignation rates were low, but for management and professionals they were still double the European rate • Around one in every five employees resigning were in their first year of service, while one in every 2½ had a tenure of between 0 and 3 years • Absenteeism was very low • Time-to-fill and acceptance rate data were not available from SA sector
The Executive ScorecardLeveraging Human Capital Performance Human Investment Ratio Wealth Created per FTE Net operating costs per FTE Profit per FTE Income per FTE Headline People Measures HR Deliverables What you have What you want HR Efficiency Value Creation Productivity Training hours per FTE Remuneration / Revenue HR Costs / Total Costs Performance pay / Rem. True Labour Costs FTE / HR FTE Resignation rate Remuneration. / Costs HR Professionalism Recruitment &promotion rates Average Remuneration Acceptance Rate & Time to fill Outsource Rate Absence rate Demographic Representation
Benchmarking Results Executive Scorecard
Benchmarking Results Executive Scorecard Headline Measures