Download

1 / 30
300 likes | 479 Views
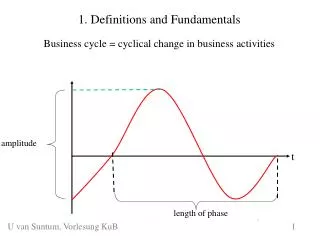
t. 1. Definitions and Fundamentals. Business cycle = cyclical change in business activities . amplitude. length of phase. 1. U. van Suntum. KuB 1.1. U van Suntum, Vorlesung KuB 1.

E N D
t 1. Definitions and Fundamentals Business cycle = cyclical change in business activities amplitude length of phase 1 U. van Suntum KuB 1.1 U van Suntum, Vorlesung KuB 1
Cycle-types (Josef Schumpeter, Business Cycles, 1939) • Kitchins (3 years storage-cycles) • Juglars (10 years investment-cycles) • Kondratieffs (50 – 60 years construction and innovation-cycles) GDPreal GDPreal Reality: Cycle-types overlap Theory: ideal types time t time t 2 U. van Suntum KuB 1.1 U van Suntum, Vorlesung KuB 2
Previous classification of cycle-phases (Gottfried Haberler, Prosperity and Depression, 1937) GDPreal 3. crisis 4. recovery GDPtrend 1. boom 2. recession time t • today: rising trend => growth rates of GDP are relevant 3 U. van Suntum KuB 1.1 U van Suntum, Vorlesung KuB 3
ln BIP ln BIP PP Trend t Business Cycle vs. Economic Growth • Definition I: • growth = trend of GDP • cycles = cyclical deviations from trend • Definition II: • growth = rise in potential output • cycles = cyclical change of capacity utilization t 4 U. van Suntum KuB 1.1 U van Suntum, Vorlesung KuB 4
Definitions Capacity utilization: (PO = potential output) Output-Gap: 5 U. van Suntum KuB 1.1 U van Suntum, Vorlesung KuB 5
6 U. van Suntum KuB 1.1 U van Suntum, Vorlesung KuB 6
Alternative definitions of a recession (cf. SVR JG 2008, S. 78) • Common definition: recession = real GDP (seasonally adjusted) declines for several (mostly: three) quarters shortcomings: lagged publication of GDP, frequent revisions • National Bureau of Economic Research: recession = substantial decline in several indicators (GDP, industrial production, sales…) for more than a few months shortcomings: lagged publication, not very precise • SVR: recession = decline of a (negative) relative output-gap of at least 2/3 of potential growth rate shortcomings: different calculations of potential output, definition sophisticated U. van Suntum, KuB 7 U van Suntum, Vorlesung KuB 7
Example for SVR-definition of a recession(cf. JG 2008/09, S. 80) • Relative Output-gap 2008: + 0,9% • Relative Output-gap 2009: - 0,5% =>decline of output-gap -1,4 percentage points • potential output growth 2008: 1,6% • Two thirds from that: 1,1% • Difference > 0? 1,4 > 1,1 • Output-gap 2009 <0? -0,5 < 0 recession U. van Suntum, KuB 8 U van Suntum, Vorlesung KuB 8
GDPreal/PO Upper turning point Normal level of CU lower turning point upswing downswing time Cycle phases according to German Council of Economic Advisors (capacity utilization) 9 U. van Suntum KuB 1.1 U van Suntum, Vorlesung KuB 9
Concept of anticyclical business cycle policy (Keynes 1936) • General Idea: Smoothing of cycles • upswing: Budget-surplus, contractionary policy • downswing/recession: Budget-deficits, expansionary policy • on average (long run): balanced budget 10 U. van Suntum KuB 1.1 U van Suntum, Vorlesung KuB 10
„hard“(e.g. retail sales) • „weak“ (e.g. consumer confidence) • single (e.g. quantity of money) • composite (e.g. FAZ-Indikator) • real (e.g. orders, production) • monetary (e.g. interest rates, prices) Classification of cycle indicators • leading (e.g. orders) • coinciding (e.g. industrial production) • lagging (e.g. employment) 11 U. van Suntum KuB 1.1 U van Suntum, Vorlesung KuB 11
gGDP (leading indicators) (coinciding indicators) (lagging indicators) t 12 U. van Suntum KuB 1.1 U van Suntum, Vorlesung KuB 12
Leading indicators • orders • business climate • consumer confidence • stocks • monetary growth • interest rate spread 13 U. van Suntum KuB 1.1 U van Suntum, Vorlesung KuB 13
Coinciding indicators • industrial production • GDP • capacity utilization • output gap • retail sales 14 U. van Suntum KuB 1.1 U van Suntum, Vorlesung KuB 14
Lagging indicators • inflation rate • unemployment rate • employment growth • interest rates 15 U. van Suntum KuB 1.1 U van Suntum, Vorlesung KuB 15
Confidence indicators in Germany Ifo-business expectations industrie ZEW-business cycle expectations 16 U. van Suntum KuB 1.1 U van Suntum, Vorlesung KuB 16
17 U. van Suntum KuB 1.1 U van Suntum, Vorlesung KuB 17
U. van Suntum KuB 1.1 U van Suntum, Vorlesung KuB 18
Turning points: Level vs. Growth rate GDP t gBIP t 0 => Turning points of growth are leading 19 U. van Suntum KuB 1.1 U van Suntum, Vorlesung KuB 19
Why cycle forecast is principally limited*) KuB 3.1 20 KuB 4 20 *) Source: S. Klein, Alles Zufall, Hamburg 2004, S. 50 f. U van Suntum, Vorlesung KuB 20
KuB 3.1 21 KuB 4 21 Small inexactness... U van Suntum, Vorlesung KuB 21
KuB 3.1 22 KuB 4 22 ...amounts to total ignorance! U van Suntum, Vorlesung KuB 22
KuB 3.1 23 KuB 4 23 GDP-forecast and reality U van Suntum, Vorlesung KuB 23
KuB 3.1 24 KuB 4 24 % U van Suntum, Vorlesung KuB 24
KuB 3.1 25 KuB 4 25 SVR-forecast vs naive forecast U van Suntum, Vorlesung KuB 25
Digression: continuous vs. discrete growth discrete: continuous: • discrete rates are both better applicable in empirical research and more easily accessible • continuous rates are both better applicable in theoretical research and more elegant 26 U. van Suntum KuB 1.1 U van Suntum, Vorlesung KuB 26
Digression (continued): calculus using growth rates continuous: discrete: Only with small growth rates are the differences negligible! 27 U. van Suntum KuB 1.1 U van Suntum, Vorlesung KuB 27
Exercise (I) 28 U. van Suntum KuB 1.1 U van Suntum, Vorlesung KuB 28
Exercise (II) 29 U. van Suntum KuB 1.1 U van Suntum, Vorlesung KuB 29
Learning goals / review questions • How do we classify the business cycle? • How do we define capacity utilization and the output gap • Which indicators are leading, lagging, coincident? • What are the differences and comparative advantages of discrete vs. continuous growth rates? • How do we calculate them? U. van Suntum KuB 1.1 U van Suntum, Vorlesung KuB 30