Download
1 / 37
380 likes | 501 Views
Costs of reducing carbon emissions in the U.S.: Some recent results. Jonathan Koomey, Ph.D. Lawrence Berkeley National Laboratory JGKoomey@lbl.gov, 510/486-5974, http://enduse.lbl.gov/ To download the report discussed here, go to http://www.ornl.gov/ORNL/Energy_Eff/CEF.htm

E N D
Costs of reducing carbon emissions in the U.S.: Some recent results Jonathan Koomey, Ph.D. Lawrence Berkeley National Laboratory JGKoomey@lbl.gov, 510/486-5974, http://enduse.lbl.gov/ To download the report discussed here, go to http://www.ornl.gov/ORNL/Energy_Eff/CEF.htm To download the talk:http://enduse.lbl.gov/shareddata/lewisandclarktalk.ppt Presented in Portland, OR at Lewis and Clark College Fourth Annual Symposium on Environmental Affairs October 19, 2001 Environmental Energy Technologies
SUMMARY OF TALK • Context on assessing GHG mitigation costs • Background on Clean Energy Futures (CEF) study & methodology • Energy and carbon results • Economic results • Conclusions
ECONOMICS OF CLIMATE CHANGE MITIGATION HOTLY DEBATED • Many respected institutions on both sides of the heated discussion, BUT • There is some common ground: • Some successful policies both save money and reduce pollution • The real debate is over how many of such policies actually exist and how successful they will be if scaled up.
THE ECONOMIST’S STATEMENT • On February 13, 1997, two thousand economists, including 6 Nobel Laureates, declared: Economic studies have found that there are many potential policies to reduce greenhouse-gas emissions for which the total benefits outweigh the total costs. For the United States in particular, sound economic analysis shows that there are policy options that would slow climate change without harming American living standards, and these measures may in fact improve U.S. productivity in the longer run.
AT THE CORE OF THE DEBATE • Are there $20 bills on the sidewalk? • Most economists say no, on theoretical grounds, because someone would have picked them up already • Some economists and most engineers, physicists, and business practitioners say yes, on empirical grounds (they see the opportunities with their own eyes). • Ultimately an empirical question.
BACKGROUND • The previous “5-lab Study”: Scenarios of U.S. Carbon Reductions (1997) was influential, but was criticized because it did not • explicitly identify technologies, programs, and policies; • treat fuel price interactions; or • incorporate macroeconomic impacts of an emissions trading system. • CEF was undertaken to address these key criticisms.
BACKGROUND (Continued) • The Clean Energy Futures (CEF) Study Initiated by the U.S. Department of Energy in Nov. 1998. • Goal: to identify and analyze policies that promote efficient and clean energy technologies to reduce carbonemissions and improve oil security and air quality • Published in Nov. 2000
LABORATORY TEAM LEADS Study Design/Integration Marilyn Brown, ORNL Mark Levine, LBNL Walter Short, NREL Transportation David Greene, ORNL Steve Plotkin, ANL ANL = Argonne National Laboratory (ANL) LBNL = Lawrence Berkeley National Laboratory (LBNL) NREL = National Renewable Energy Laboratory (NREL) ORNL = Oak Ridge National Laboratory (ORNL) PNNL = Pacific Northwest National Laboratory (PNNL) Buildings Jon Koomey, LBNL Andrew Nicholls, PNNL Electricity Stan Hadley, ORNL Walter Short, NREL NEMS Modeling/ Economic Integration Jon Koomey, LBNL Marilyn Brown, ORNL Macro-Economic Modeling Alan Sanstad, LBNL Gale Boyd, ANL Industry Lynn Price, LBNL Ernst Worrell, LBNL
METHODOLOGY: DIFFERENT MODELING APPROACHES • Top down/econometric • Bottom-up/engineering-economic • Hybrids (like CEF-NEMS) N.B., All methods susceptible to the inappropriate use of historically-based parameters to model futures that are quite different from the business-as-usual case.
METHODOLOGY (CONTINUED) • Analyze and compile latest technology data by sector and end-use. • Define scenarios in detail, relying on program experience and judgment. • Change decision parameters and technology costs in CEF-NEMS to reflect the scenarios. • Run the CEF-NEMS model and associated spreadsheets to capture fuel-price feedbacks and direct cost impacts. • Analyze second-order impacts of emissions trading using latest literature.
TWO SCENARIOS Defined by policies that reflect increased levels of national commitment to energy and environmental goals. (1) Moderate Scenario: relatively non-intrusive, no-regrets or low-cost policies. • assumes some shift in political will & public opinion • excludes fiscal policies that involve taxing energy (2) Advanced Scenario: more vigorous policies. • assumes a nationwide sense of urgency • includes a domestic carbon trading system with assumed permit price of $50/tC. The scenarios are not forecasts or recommendations; they are possible pathways to a cleaner energy future.
KEY POLICIES-ADVANCED SCENARIO* *The scenarios are defined by approximately 50 policies. These 10 are the most important ones in the Advanced scenario. Each policy is specified in terms of magnitude and timing (e.g., “431 kWh/year dishwasher standard implemented in 2010”).
Enhanced R&D is estimated to improve technologies in all sectors.
RESULTS: ENERGY USE Efficiency RD&D policies Energy Use (in Quads) Advanced Scenario (~20% reduction in 2020)
RESULTS: CARBON EMISSIONS Need for R&D delays impacts on transportation, but by 2020 emission reductions are large. Electric sector policies account for a third of the carbon reductions in the Advanced scenario.
THE ECONOMICS: Energy bill savings exceed investment costs, and the gap grows over time. Moderate Scenario Advanced Scenario
RESULTS: DIRECT COSTS IN 2010 (units: Billions US $/year) (units: Billions US $/year)
THE ECONOMICS • Based on data from EMF 16 and worst case assumptions (no smart revenue recycling of advanced case carbon trading fees), indirect macroeconomic costs are in the same range as net direct benefits. • Important transition impacts and dislocations could still be produced in the advanced case (e.g., reduced coal and railroad employment). • “Green” industries could grow significantly (e.g., wind, agriculture, and energy efficiency).
CONCLUSIONS • Smart public policies can significantly reduce not only carbon dioxide emissions, but also local air pollution, petroleum dependence, and inefficiencies in energy production and use. • RD&D, voluntary programs, efficiency standards, and other non-price policies play a critical role in the realization of these scenarios. • The overall economic benefits of these policies appear to be comparable to their overall costs.
Enhance your critical thinking skills http://www.numbersintoknowledge.com New book, just released! Analytics Press, 2001 ISBN 0-9706019-0-5
If energy efficiency is such a good idea, why don’t people do it anyway? Engineering-economic analysis plus transaction costs Results with policy or program that reduces transaction costs Engineering-economic analysis Source: Adapted from Katrin Ostertag Transaction costs of raising energy efficiency. Working paper, May 1999. Presented at the IEA International Workshop on Technologies to Reduce Greenhouse Gas Emissions: Engineering-Economic Analyses of Conserved Energy and Carbon. Washington, DC. 5-7 May 1999. This example assumes that the energy efficient technology delivers the exact same service as the standard technology.
Market Imperfections: Efficient Magnetic Ballast Market Shares
Market Imperfections: Real IRRs for Efficient Magnetic Ballasts Based on market data in the US commercial sector (circa 1989)
Standby power for TVs Source: Karen Rosen, LBNL, May 1999, KBRosen@lbl.gov Share of units measured
Buildings • Voluntary programs and equipment standards are the key policy mechanisms in this sector. • Many small end-uses (“other”) are large contributors to total carbon savings. Lighting is also important. Residential Commercial
Industry • Key Policies: Voluntary programs (technology demonstrations, energy audits, financial incentives), voluntary agreements between government and industry, and doubling cost-shared federal R&D. • Key Crosscutting Technologies: Combined heat and power, preventive maintenance, pollution prevention, waste recycling, process control, stream distribution, motor and drive system improvements. • Numerous subsector-specific technologies play a role.
Industry • Cement, iron & steel, and other energy-intensive industries save the most energy. • Pulp and paper industry reduces its carbon emissions by 41% in the Advanced scenario.
Industry: Combined Heat and Power • BAU New Capacity: 4 GW by 2010 9 GW by 2020 • Advanced Scenario New Capacity: 29 GW by 2010 76 GW by 2020 • In 2020, this saves: 2.4 quads of energy 40 MtC of emissions
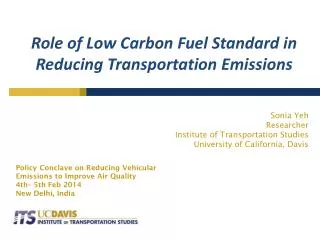
Transportation KEY POLICIES: • Doubling cost-shared federal R&D is critical to achieving a greater degree of technological success • Voluntary commitments by vehicle manufacturers to fuel economy goals • Pay-at-the-pump insurance fees • Domestic carbon trading system
Transportation Technologies Turbo-charged direct injection (TDI) diesels and hydrogen fuel cell vehicles play a major role by 2020. Sales of New Vehicles (in 1,000s)
Transportation Efficiency Technologies • Gasoline Engine Technology Only, Year 2020 • (28.6 to 44.1 MPG, or 8.2 to 5.3 l/100 km) Passenger Car MPG Improvements (Advanced Scenario)
Electricity • Key Policies: domestic carbon trading system, restructuring of the electricity industry, production tax credit for non-hydro renewable energy, and R&D. • Key Technologies: natural gas combined cycle plants, wind power, nuclear relicensing, biomass, and geothermal.
Non-Hydro Renewable Electric Generation in the Advanced Scenario (TWh)