Download
1 / 38
380 likes | 484 Views
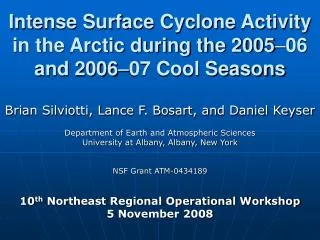
Intense Surface Cyclone Activity in the Arctic during the 2005 – 06 and 2006 – 07 Cool Seasons. Brian Silviotti, Lance F. Bosart, and Daniel Keyser Department of Earth and Atmospheric Sciences University at Albany, Albany, New York NSF Grant ATM-0434189

E N D
Intense Surface Cyclone Activity in the Arctic during the 2005–06 and 2006–07 Cool Seasons Brian Silviotti, Lance F. Bosart, and Daniel Keyser Department of Earth and Atmospheric Sciences University at Albany, Albany, New York NSF Grant ATM-0434189 10th Northeast Regional Operational Workshop 5 November 2008
Motivation Major Arctic Shipping Routes • Arctic cyclones not extensively studied • Intense arctic cyclones pose economic hazards, especially to shipping Source: www.hofstra.edu
Purpose • Establish a limited track climatology of intense arctic surface cyclones • Relate track climatology to large-scale arctic flow • Examine cyclone mergers • Perform a brief case study of a cyclone merger event
Datasets • GFS 0.5° analysis • Storm-track climatology and case study • NCEP–NCAR Reanalysis • Large-scale mean/anomaly computations • CPC daily teleconnection indices • 1 Jan 1950 – 30 Jun 2008 • Sources • UAlbany DEAS data archive • ESRL • CPC
Methodology • Definitions • Cool season: 1 Oct – 31 Mar • Arctic: poleward of 50°N • Intense cyclone: central MSLP ≤ 980 hPa • Manually analyzed surface maps • Genesis/lysis time • Position and track • Central pressure • Merger/nonmerger
Large-scale Arctic Flow Representation • Use teleconnection indices • Arctic Oscillation (AO) and North Atlantic Oscillation (NAO) • Normalize CPC datasets • Obtain a mean (μ) of 0 and a standard deviation (σ) of 1 for each index dataset
Large-scale Arctic Flow Representation • Define regimes • AO/NAO must remain in the positive or negative phase for at least five consecutive days for a time period to qualify as a positive or negative regime • All other time periods qualify as neutral regimes
2005–06 Cool-season AO/NAO Time Series AO NAO Red shading: positive regime Blue shading: negative regime
2006–07 Cool-season AO/NAO Time Series AO NAO Red shading: positive regime Blue shading: negative regime
2005–06 Cool-season 300 hPa Height Anomaly and Wind Speed Wind Speed Height Anomaly CI = 2.5 m s−1 CI = 10 m μAO = −0.35 Source: www.esrl.noaa.gov μNAO = −0.22
2006–07 Cool-season 300 hPa Height Anomaly and Wind Speed Wind Speed Height Anomaly CI = 2.5 m s−1 CI = 10 m μAO = 0.52 Source: www.esrl.noaa.gov μNAO = 0.13
Large-scale Arctic Flow Summary • 2005–06 Cool Season • Mainly negative AO/NAO pattern • Weakened polar jet • 2006–07 Cool Season • Mainly positive AO/NAO pattern • Strengthened polar jet
2005–06 Cool-season Storm Tracks Oct–Nov Dec–Jan Feb–Mar • 50 Storms • Oct–Nov: 20 • Dec–Jan: 21 • Feb–Mar: 9
2006–07 Cool-season Storm Tracks Oct–Nov Dec–Jan Feb–Mar Case Study • 95 Storms • Oct–Nov: 25 • Dec–Jan: 46 • Feb–Mar: 24
Cyclogenesis Events vs. AO/NAO Regime (2005–07) • Arctic more active during neutral to positive AO/NAO regimes (strengthened polar jet)
Merger Locations by Month (2005–07) Oct–Nov Dec–Jan Feb–Mar Case Study • 39 Mergers • Oct–Nov: 11 • Dec–Jan:17 • Feb–Mar: 11 Arctic–Arctic Mergers 21 Arctic–Midlatitude Mergers 18
Merger Locations by Strength (2005–07) 970–980 hPa 960–969 hPa 950–959 hPa < 950 hPa Case Study • 39 Mergers • 970–980 hPa:15 • 960–969 hPa: 13 • 950–959 hPa: 9 • < 950 hPa:2 Arctic–Arctic Mergers Arctic–Midlatitude Mergers
Case Study • Example of an arctic–midlatitude cyclone merger event • Occurred over the North Atlantic southeast of Greenland during 7–11 Dec 2006 • Two surface cyclones and three positive potential vorticity (PV) anomalies merged
Surface Low Tracks and 500 hPa Mean Height 500 hPa mean height (dam) for 6–12 Dec 2006
MSLP Time Series • Well-developed, rapidly strengthening midlatitude cyclone absorbs arctic cyclone • System deepens 53 hPa in 24 h (1800 UTC 8 Dec – 1800 UTC 9 Dec) • Merged cyclone reaches lowest MSLP value of 928 hPa on 1200 UTC 10 Dec
PV Anomaly Tracks • PV anomaly “A” breaks off high PV reservoir over Siberia (21 Nov) • PV anomalies “C” and “D” break off high PV reservoir over North Pole (3–4 Dec) • PV anomaly “B” breaks off PV anomaly “A” over Labrador Sea (6 Dec) • PV anomalies “B,” “C,” and “D” merge over North Atlantic (10 Dec)
Surface Lows and PV Anomalies • PV anomaly “B” induces arctic cyclone on 0000 UTC 7 Dec • PV anomaly “D” induces midlatitude cyclone on 0000 UTC 8 Dec • PV anomaly “C” merges with “B” and “D,” helping merged cyclone intensify
1200 UTC 8 Dec 2006 Sounding for Upton, NY Dynamic Tropopause Height: 2630 m QG Rossby Penetration Depth for PV anomaly “D”: 10320 m PV anomaly D
0000 UTC 7 Dec 2006: 300 hPa Wind Speed (kt), 1000–500 hPa Thickness (dam), MSLP (hPa)
1200 UTC 7 Dec 2006: 300 hPa Wind Speed (kt), 1000–500 hPa Thickness (dam), MSLP (hPa)
0000 UTC 8 Dec 2006: 300 hPa Wind Speed (kt), 1000–500 hPa Thickness (dam), MSLP (hPa)
1200 UTC 8 Dec 2006: 300 hPa Wind Speed (kt), 1000–500 hPa Thickness (dam), MSLP (hPa)
0000 UTC 9 Dec 2006: 300 hPa Wind Speed (kt), 1000–500 hPa Thickness (dam), MSLP (hPa)
1200 UTC 9 Dec 2006: 300 hPa Wind Speed (kt), 1000–500 hPa Thickness (dam), MSLP (hPa)
0000 UTC 10 Dec 2006: 300 hPa Wind Speed (kt), 1000–500 hPa Thickness (dam), MSLP (hPa)
1200 UTC 10 Dec 2006: 300 hPa Wind Speed (kt), 1000–500 hPa Thickness (dam), MSLP (hPa)
0000 UTC 11 Dec 2006: 300 hPa Wind Speed (kt), 1000–500 hPa Thickness (dam), MSLP (hPa)
1200 UTC 11 Dec 2006: 300 hPa Wind Speed (kt), 1000–500 hPa Thickness (dam), MSLP (hPa)
Conclusions • 145 intense arctic surface cyclones occurring over both cool seasons yielding a frequency of 10–15 per month • High intraseasonal and interannual variability • Arctic most active in neutral to positive AO/NAO regimes • Strengthened polar jet associated with higher frequency of intense arctic storms
Conclusions • Storms most frequent over Gulf of Alaska/Aleutians and North Atlantic/East Arctic Oceans • Clustering near end of well-known storm tracks • Atlantic more active than the Pacific • More storms tend to form farther north in the Atlantic
Conclusions • All mergers occur poleward of 50°N • Storms stay or move into the arctic • Arctic–midlatitude mergers typically occur when southern storm is well developed • Arctic storm provides extra vorticity; expedites vorticity growth
Further Research • Use automated tracking program to include several more cool seasons • Other aspects of cyclones vs. regimes • Intensity • Mean location • Merger/nonmerger • Merger Behavior • Strongest mergers southeast of Greenland • Arctic–arctic vs. arctic–midlatitude mergers