
Comparative Analysis of Deuteron Incorporation in Various Proteins Using DXCOREX Calculations
This study investigates deuteron incorporation in hen egg lysozyme, equine lysozyme, the catalytic subunit of PKA E230Q, and the α-actinin CH2 domain, employing DXCOREX calculations. The results are compared with NMR-determined values, highlighting the correlation between calculated and experimentally determined incorporation levels. Figures illustrate the regression analysis of deuteron incorporation per peptide across several proteins, revealing varying levels of proteomic behavior in different pH conditions. This work contributes to our understanding of protein dynamics and interactions.

Comparative Analysis of Deuteron Incorporation in Various Proteins Using DXCOREX Calculations
E N D
Presentation Transcript
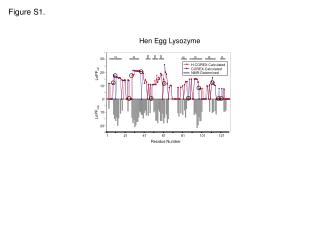
30 H-COREX-Calculated COREX-Calculated 20 NMR-Determined LnPFcal 10 0 LnPFexp 10 20 1 21 41 61 81 101 121 Residue Number Figure S1. Hen Egg Lysozyme
18 12 LnPFcal 6 0 6 LnPFexp 12 18 1 21 41 61 81 101 121 Residue Number H-COREX-Calculated COREX-Calculated NMR-Determined Figure S2. Equine lysozyme
20 y = 0.91x - 0.23 2 R = 0.75 15 10 deuteron incorporation per peptide DXCOREX-calculated 5 0 0 5 10 15 20 Experimentally-determined deuteron incorporation per peptide Figure S3. Catalytic subunit of PKA E230Q
8 y = 1.06x + 0.15 2 R = 0.82 6 4 deuteron incorporation per peptide DXCOREX-calculated 2 0 0 2 4 6 8 Experimentally-determined deuteron incorporation per peptide Figure S4. -actinin CH2 domain
20 y = 0.73x + 0.45 2 R = 0.80 15 deuteron incorporation per peptide DXCOREX-calculated 10 5 0 0 5 10 15 20 Experimentally-determined deuteron incorporation per peptide Figure S5. Rosiglitazone-bound PPAR LBD
Figure S6. pH = 6.1 pH = 8.8 (A) (B)
Table S1. Study Proteins


