Download
1 / 53
540 likes | 644 Views
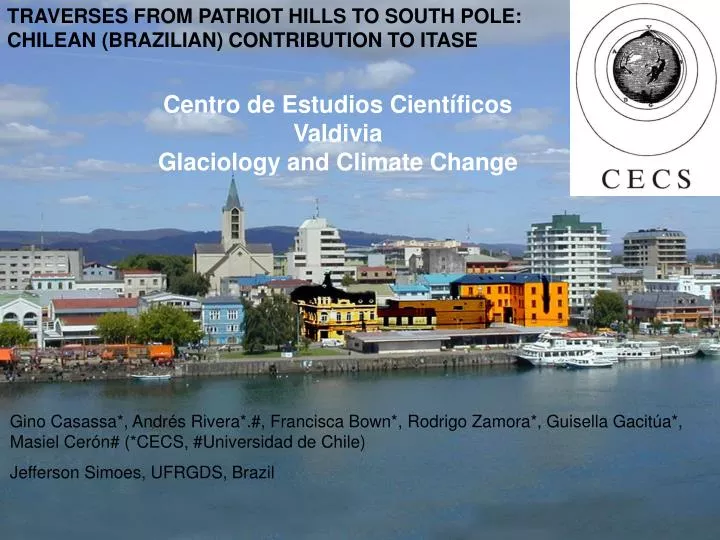
TRAVERSES FROM PATRIOT HILLS TO SOUTH POLE: CHILEAN (BRAZILIAN) CONTRIBUTION TO ITASE. Centro de Estudios Científicos Valdivia Glaciology and Climate Change. Gino Casassa*, Andrés Rivera*.#, Francisca Bown*, Rodrigo Zamora*, Guisella Gacitúa*, Masiel Cerón# (*CECS, #Universidad de Chile)

E N D
TRAVERSES FROM PATRIOT HILLS TO SOUTH POLE: CHILEAN (BRAZILIAN) CONTRIBUTION TO ITASE Centro de Estudios Científicos Valdivia Glaciology and Climate Change Gino Casassa*, Andrés Rivera*.#, Francisca Bown*, Rodrigo Zamora*, Guisella Gacitúa*, Masiel Cerón# (*CECS, #Universidad de Chile) Jefferson Simoes, UFRGDS, Brazil
VEHICLE: BERCO TL-6 CREW CAB, SWEDEN COST: ~ USD 750,000 CONVOY LENGTH: 32 m VEHICLE LENGTH & WEIGHT: 8 m – 6.6 ton CONVOY PAYLOAD: 20 ton ENGINE: CUMMINS EURO III B 5.9 ECHO 250 HP FUEL: DIESEL-JA1 FUEL COMPT.: 0.2-0.4 km/l (2.5-5.0 l/km) MAXIMUM ROAD SPEED: 40 km/h MAX SPEED OVER SNOW WITH LOAD: 14 km/h MAX. SPEED OVER DEEP SNOW (>2000 m a.s.l.): 8 km/h
2004/2005 • VHF chirp radar at 150 MHz from P.Hills to S.Pole (U. Kansas radar) • 400 MHz GPR from S.Pole to Patriot Hills • kinematic GPS for surface positioning • deployment of stakes every ~20 km measured by static GPS for velocity & accumulation • shallow firn coring (~46 m depth) at 7 sites every 2° latitude • surface snow samples every ~10 km for chemical analysis • Surface snow density • gravity measurements every ~20 km for determination of crustal structure, associated isostatic conditions and geoid determination • Geodetic reference point on rock south of Thiel Mountains
STATISTICS P. HILLS-S.POLE: 1145 km, 18 days S.POLE STAY: 8 days (repairs, refueling, firn drilling) S.POLE-P.HILLS: 1266 km, 23 days (including 130 km to Thiel Mts.) 1145 km of radar ice depth data (~1,000 ~ 3,000 m depth) 1145 km of shallow (~ 60 m) radar snow stratigraphy data 1145 km x 2 = 2290 km of precise GPS data Short-term ice velocity on 54 stakes every 20 km along the route Precise gravity data every 10 km along the route Surface (top 1.2 m) snow density data every 20 km along the route 105 surface snow samples (every 10 km along the route) 225 m of firn density cores at 7 sites along the route GPS measurements of 1 geodetic rock point at Lewis Nunatak, Thiel Mts. GPS measurements of 10 geodetic rock points at P.Hills GPS re-measurements at 165 snow/ice sites at P.Hills within a radius of 30 km Meteorological measurements at P.Hills every 3 h
ONGOING ANALYSIS OF 2004 CORES MAINE (Paul Mayewski et al.) Maine: Stables isotopes, ionic chromatography, traces by ICP-MS. BRAZIL (Jefferson Simoes et al.) Microparticle analysis (Porto Alegre) Tritium DNA traces CHILE (Masiel Cerón - Ph.D. Chemistry Student – University of Chile) - Prof. Andrés Rivera – CECS) Analysis of dioxines and total arsenic of Ice Cores 5 and 6 acquired by PSI Switzerland in 2004 and an ice core record from Cerro Mercedario (central Andes, 30°S, 6100 m)
Dec 2007- Jan 2008
2007/2008 • VHF chirp radar at 150 MHz (ULUR radar, Ulloa et al., 2008) • 400 MHz GPR from Patriot Hills to South Pole • kinematic GPS for surface positioning • deployment of stakes every ~20 km measured by static GPS for velocity & accumulation • shallow firn coring (~20 m depth) at 2 sites ~220 km apart • surface snow samples every ~40 km for biological analyses & every 20 km for chemical analysis • gravity measurements every ~20 km for determination of crustal structure, associated isostatic conditions and geoid determination • determination of surface roughness, its relation with local patterns of snow accumulation and correlation with satellite imagery texture
Algunos resultados preliminares en la ruta al Polo sur… 53 balizas instaladas en la expedición 2004……19 balizas encontradas en la expedición 2007 Balizas encontradas de la expedición pasada
Valores de acumulación (mm/año agua eq) calculados entre los 84° y los 90°S Este método: 115 mm/año eq ag Radar GPR: 120 mm/año eq ag Promedio acumulación anual: 84 mm año eq agua
Estimaciones de acumulación (mm/año agua eq) a lo largo de toda la ruta P.Hills-Polo Sur >120 mm/yr w eq. ~80 mm yr w eq
Biological analyses of snow/ice cores Pamela Santibañez
Autumn - Winter Winter - Spring Spring - Summer snowfall Dust, microalgae and other material are transported to the glacier surface by wind Light Light decrease Accumulation Ablation Algal layer is incorporated inside the glacier Formation of algal layers Melting Freezing Temperature increase Temperature decrease BIOLOGICAL ANALYSIS INTRODUCTION TEMPERATE GLACIERS • Melt and percolation (e.g. Schwikowski et al., 1999; Eichler et al., 2001) • Previous studies • Yala glacier in the Nepal Himalayas (Yoshimura et al., 2000). Ice core dating with microalgae. • Tyndall glacier in the Southern Patagonia Icefield, Chile (Shiraiwa et al., 2002; Kohshima et al., 2007). Dating and estimation of past mass balance. • Sofiyskiy Glacier in the Russian Altai (Uetake et al., 2006). Dating and estimation of past mass balance with microalgae and pollen. • Mocho-Choshuenco volcano and Osorno volcano in the Chilean lake district (Santibañez et al., in press) Dating and estimation of past mass balance with microalgae, pollen and protozoa (testate amoebae) Chlamydomonas nivalis, Chloromonas sp microalgaegenre/species reino – phylum (division) - clase - orden - familia- genero y especie
MATERIALS AND METHODS BIOLOGICAL ANALYSIS • Sample analysis • Laminar flow table • Hydrophilic polytetrafluoroethylene (PTFE) membrane filters • (JHWP1300: 0.2 mm pore size, 13 mm diameter; Millipore, USA). • Each filter mounted and fixed in glycerol, formalin and water solution (volume 1:1:1) • Counts of microorganisms and pollen grains • Fluorescent microscope • (OLYMPUS BX-FLA). • Scanning electron microscope (SEM), UACH. • Technique developed by Yoshimura et al. (1997, 2000) • Microalgae and pollen measured with resolution of 4-6 cm • Filtering of 30 ml each sample (25-50 ml)
FIRST RESULTS SAN VALENTIN BIOLOGICAL ANALYSIS Podocarpaceae = mañío, lleuque Algal Biovolume (x102mm3 mL-1) Podocarpaceae (Grains L-1) Autumn 2007 Autumn 2007 accumulation 63 cm of snow Net mass balance 2006-2007 (early autumn 2006 to early autumn 2007) 53.7 cm of snow. Low for Patagonia, but same order of magnitude as Vimeux et al., in press Summer 2006/07 Summer 2005/06 Winter accumulation >53 cm of snow Initial evidence of non Podocarpaceae pollen