Download
1 / 20
200 likes | 331 Views
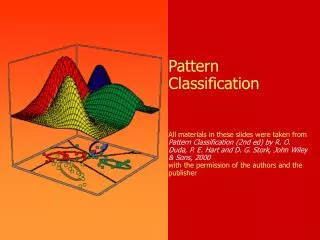
Pattern Classification All materials in these slides were taken from Pattern Classification (2nd ed) by R. O. Duda, P. E. Hart and D. G. Stork, John Wiley & Sons, 2000 with the permission of the authors and the publisher. Chapter 4 (part 2): Non-Parametric Classification (Sections 4.3-4.5).

E N D
Pattern ClassificationAll materials in these slides were taken from Pattern Classification (2nd ed) by R. O. Duda, P. E. Hart and D. G. Stork, John Wiley & Sons, 2000with the permission of the authors and the publisher
Chapter 4 (part 2):Non-Parametric Classification (Sections 4.3-4.5) Parzen Window (cont.) Kn –Nearest Neighbor Estimation The Nearest-Neighbor Rule
x1 x2 . . . xd Parzen Windows (cont.) • Parzen Windows – Probabilistic Neural Networks • Compute a Parzen estimate based on n patterns • Patterns with d features sampled from c classes • The input unit is connected to n patterns . . . . . W11 p1 p2 . . . Input patterns Input unit . . Wd2 Wdn pn Modifiable weights (trained)
. . pn . p1 . p2 Input patterns . . . 1 . 2 . . . Category units . pk . . . . c pn Activations (Emission of nonlinear functions)
Training the network • Algorithm • Normalize each pattern x of the training set to 1 • Place the first training pattern on the input units • Set the weights linking the input units and the first pattern units such that: w1 = x1 • Make a single connection from the first pattern unit to the category unit corresponding to the known class of that pattern • Repeat the process for all remaining training patterns by setting the weights such that wk = xk (k = 1, 2, …, n) We finally obtain the following network
Testing the network • Algorithm • Normalize the test pattern x and place it at the input units • Each pattern unit computes the inner product in order to yield the net activation and emit a nonlinear function • Each output unit sums the contributions from all pattern units connected to it • Classify by selecting the maximum value of Pn(x | j) (j = 1, …, c)
Kn - Nearest neighbor estimation • Goal: a solution for the problem of the unknown “best” window function • Let the cell volume be a function of the training data • Center a cell about x and let it grows until it captures knsamples (kn = f(n)) • knare called the knnearest-neighbors of x 2 possibilities can occur: • Density is high near x; therefore the cell will be small which provides a good resolution • Density is low; therefore the cell will grow large and stop until higher density regions are reached We can obtain a family of estimates by setting kn=k1/n and choosing different values for k1
Illustration For kn = n = 1 ; the estimate becomes: Pn(x) = kn / n.Vn = 1 / V1 =1 / 2|x-x1|
Estimation of a-posteriori probabilities • Goal: estimate P(i | x) from a set of n labeled samples • Let’s place a cell of volume V around x and capture k samples • kisamples amongst k turned out to be labeled ithen: pn(x, i) = ki /n.V An estimate for pn(i| x) is:
ki/k is the fraction of the samples within the cell that are labeled i • For minimum error rate, the most frequently represented category within the cell is selected • If k is large and the cell sufficiently small, the performance will approach the best possible
The nearest –neighbor rule • Let Dn = {x1, x2, …, xn} be a set of n labeled prototypes • Let x’ Dn be the closest prototype to a test point xthen the nearest-neighbor rule for classifying x is to assign it the label associated with x’ • The nearest-neighbor rule leads to an error rate greater than the minimum possible: the Bayes rate • If the number of prototype is large (unlimited), the error rate of the nearest-neighbor classifier is never worse than twice the Bayes rate (it can be demonstrated!) • If n , it is always possible to find x’ sufficiently close so that: P(i | x’) P(i | x)
Example: x = (0.68, 0.60)t Decision:5is the label assigned to x
If P(m | x) 1, then the nearest neighbor selection is almost always the same as the Bayes selection
The k – nearest-neighbor rule • Goal: Classify x by assigning it the label most frequently represented among the k nearest samples and use a voting scheme
Example: k = 3 (odd value) and x = (0.10, 0.25)t Closest vectors to x with their labels are: {(0.10, 0.28, 2); (0.12, 0.20, 2); (0.15, 0.35,1)} One voting scheme assigns the label 2 to x since 2 is the most frequently represented