Download
1 / 18
180 likes | 353 Views
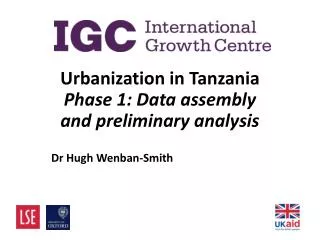
Urbanization in Tanzania Phase 1: Data assembly and preliminary analysis. Dr Hugh Wenban-Smith. Workshop objectives. Present IGC work on urbanisation in Tanzania Invite your views on directions for future work Seek collaboration with Tanzanian researchers

E N D
Urbanization in TanzaniaPhase 1: Data assembly and preliminary analysis Dr Hugh Wenban-Smith
Workshop objectives Present IGC work on urbanisation in Tanzania Invite your views on directions for future work Seek collaboration with Tanzanian researchers Foster development of a community of urban researchers here Ultimately, help to inform policies for growth linked to urbanisation
Why research urbanisation? • Popn of Dar up from 1/4m in 1965 to 4.4m in 2012 – nearly 20 times as big • Other towns in Tanzania: • Arusha – xx times • Mbeya – xx times • Mwanza – xx times • Engine of growth? (World Bank, 2009) • Big challenge to manage urban growth on this scale; need to understand what’s driving urbanisation
Census data: A great resource • Tanzania censuses: 1967, 1978, 1988, 2002 and 2012 • Provide primary data of good quality (not “Poor Numbers”) • Congratulations to NBS on a difficult job well done
Urbanisation: Our approach • Not enough to look just at growth of towns and cities • Urban areas are embedded in the wider economy and form an urban system • Need to look at dynamics – e.g. effect of population growth, conditions in rural areas, rural-urban migration and relations between large and small towns • Regional differences help to identify causes
Headline findings • Total mainland popn up from 12m to 43.6m (3.6 times) • Mainland urban popn up from 0.7m to 12.7m (18 times) • Mainland rural popn up from 11.2m to 31m (3 times) - i.e. Big increase in pressure on land and other natural resources despite rapid urbanisation
Regional analysis • Going down to regional level reveals interesting differences • Analytical tools: • Propensity for regional in-migration • Propensity for rural out-migration • Propensity for urban in-migration
Propensity for regional in-migration • P(rim) • Method • 1. Take base year regional population • 2. Add expected growth using national rate • 3. Subtract actual growth • 4. Divide by expected population • 5. Reverse sign (e.g. + instead of - ), convert to percentage (x100)
P(rim): Two examples • Lindi region 1978-2012 • 1. 527,624 • 2. + 721,312 • 3. - 337028 • 4. /1,248,936 = 0.308 • P(rim) = -30.8 • Dar region 1978-2012 • 1. 843,090 • 2. + 1,681,124 • 3. – 3,521,451 • 4. /2,524,214 = - 0.729 • P(rim) = 72.9
P(rom) and P(uim) • Method similar to P(rim) • P(rom) = Percentage of expected rural popn that migrates to own urban or other region • P(uim) = Urban in-migrants as a percentage of expected urban popn
P(rom) and P(uim) In P(rim) order (Dar on left; Lindi on right):
More findings • Regions with high out-migration also show high rural out-migration • Regions with high urban in-migration do not follow this pattern • Issues for future research • How do regions with high rural out-migration differ from those with low? • How do regions with high urban in-migration differ from those with low? • Does this change over time? Why?
Migration vs In-city growth • As urban popns grow, so does natural popn growth • Is natural growth now more important than rural-urban migration? (Cf. Zambia) • See Table 6 in working paper: in-migration still explains more than half urban growth but not for some regions (TAB, MAR, SIN, MTW and Lin)
Some data problems • Definition of ‘urban’ appears to vary between censuses • When urban boundary expands, some of population increase not due to migration • How to address these problems? • Investigate feasibility of a density based measure • Check boundary changes of regional capitals
Future Research (1) • Phase 1 work has assembled data and done some preliminary analysis • Much more work needed if we are to understand the urbanisation process so as to identify policies needed to promote future growth, for rural as well as urban areas
Future Research (2) • Phase 2 of the IGC project will investigate: • How high rural out-migration regions differ from others • How high urban in-migration regions differ from others • How urbanisation in Tanzania relates to episodes in post-Independence economic history (e.g. villagisation; SAP policies; Mining boom)
Future Research (3) • We realise that our project is only a start, at least providing usable data for other projects • Plenty of room for other researchers, e.g. What are implications for urban governance, urban finance and urban infrastructure? • Also what are implications for rural development and rural-urban interaction? • Hope we have lighted a spark of interest • Look forward to a bushfire of comments, questions and suggestions