Productivity & Rollbacks
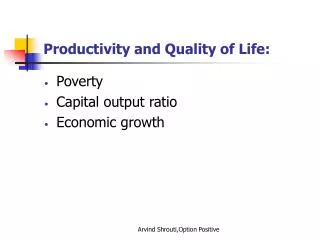
This document explores the complexities of Iowa's taxable value limitation, focusing on the implications for commercial and residential property taxes. It delves into historical data, the impact of new construction, and how tax increment financing (TIF) growth influences the perceived share of the tax burden between commercial and residential properties. Moreover, it details the agricultural productivity formula and its effect on property assessments. Understanding these elements is vital for stakeholders in Iowa's fiscal services and legislative frameworks.

Productivity & Rollbacks
E N D
Presentation Transcript
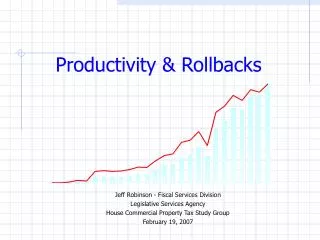
Productivity & Rollbacks Jeff Robinson - Fiscal Services Division Legislative Services Agency House Commercial Property Tax Study Group February 19, 2007
Share of Taxable Value by ClassQuestion from Last Week – Has commercial’s share of the burden been increasing? – Commercial’s share has increased, but so has residential’s.
Percent of Value Due to New Construction Since AY 1988 – Not as bad as it seems. Part of the reason commercial’s share has grown relates to new construction.
Tax Increment Financing Growth – Commercial’s share is not what it seems - Commercial and industrial property benefit from substantial growth in TIF.
Taxable Value Limitation (Rollback) • Iowa law limits growth in taxable value due to revaluation of existing property to no more than 4.0% per year. • The rollback calculation determines the percentage of a property’s actual value that will be taxable that year (productivity, not actual value for ag). • The limitation is calculated from statewide property values. • The limitation applies individually to residential, commercial, industrial, and agricultural land, including ag buildings. • Residences on ag property are included in the residential calculation. • Any increase for a class above 4.0% growth in taxable value produces (or adds to) a rollback. • The calculated rollback applies to new construction values also. • Example: If commercial taxable value due to revaluation grows 6.0%, the rollback will limit growth to 4.0% and the 2.0% difference will produce a commercial rollback to 98.00%.
Taxable Value Limitation – Ag Tie • In addition to the 4.0% limit, residential and ag property will be further limited if the taxable value growth due to revaluation in the other class is less than 4.0%. • So far, residential growth has never limited ag taxable values, and should not limit ag growth in the foreseeable future. • Examples: • If residential taxable value grows 6.0% and ag taxable value grows 2.0%, residential taxable value will be allowed to grow only 2.0%. • If residential grows 6.0% and ag property falls 4.0%, residential taxable value will not grow.
Rollback/Ag Tie – Did it prevent a shift or cause a shift?History - Actual
Rollback/Ag Tie – Did it prevent a shift or cause a shift?History – No ag tie and no 4% limit
Rollback/Ag Tie – Did it prevent a shift or cause a shift?History – 4% Limitation with no ag tie
Rollback/Ag Tie – Did it prevent a shift or cause a shift?Summary • Iowa’s taxable value limitation has shifted some burden to commercial. Without it, the shift would have been to residential property.
Ag Productivity Formula • Establishes the taxable value of an average acre of farmland for each county, including the farm buildings. • The average value times the number of farm acres equals the total taxable farmland value for the county. • Five year average. • Fiscal Year 2007 is based on crop years 1999 through 2003. • Only the calculations for equalization years (odd numbered years) really matter.
Ag Productivity Formula • Data sources: • Acres harvested, yields, price (USDA) • Pasture acres (USDA) • Federal farm payments (USDA) • Operating expenses (Iowa State University) • Cost of insurance (Iowa Division of Insurance) • Property taxes paid on farmland (Iowa Departments of Revenue & Management)
Ag Productivity Formula • Basic Procedure • Determine the five-year average value of the crop on “enumerated acres” within the county and divide by 2. • Subtract landlord’s share of expenses per acre. • Add the five-year average of federal farm payments, minus any landlord expenses, and divide by 2. • Subtract cost of insurance. • This provides the net income for the county. • Divide the net income by the total farm acres of the county. • Add a factor for “other acres” (17%). • Adjust for the contribution of the residence (-10.6%). • Subtract average property taxes paid per acre. • Divide by the capitalization rate of 7.0%. • The result is the average productivity value per acre for the county. • The assessor spreads the value to all farm property within the county, excluding the farm residence.
Ag Productivity Formula • Enumerated acres • Include only harvested acres for the following crops: • Corn • Soybeans • Oats/Wheat • Hay • Pasture • Farm programs • Does not include the value of livestock.
Ag Productivity Formula • Most Important Factors: • Value of the corn crop (price X bushels) • Value of the soybean crop (Price X bushels) • Federal payments • Landlord production costs • Property taxes paid
Ag Productivity Formula– Had ag productivity been 1% higher in AY 05, FY 2007 taxable value of both ag and residential would have been 1% higher.
Ag Productivity Formula– Ag productivity could increase by more than 8% for FY 2009. If that happens, both ag and residential taxable value will grow 4.0% for both FY 2009 and FY 2010.