Download
1 / 12
120 likes | 263 Views
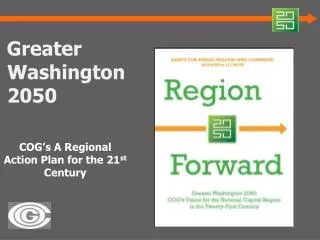
Regional Targets & Indicators. Greater Washington 2050 Planning Tools Task Force May 29 th 2009 Harriet Tregoning and Alan Imhoff. Targets and Indicators. Existing COG Data and other sources Measurable Geography of Data (Regional or Jurisdictional Level)

E N D
Regional Targets & Indicators Greater Washington 2050 Planning Tools Task Force May 29th 2009 Harriet Tregoning and Alan Imhoff
Targets and Indicators • Existing COG Data and other sources • Measurable • Geography of Data (Regional or Jurisdictional Level) • Time Frame of Data (Annual, Quarterly, or Monthly) • Linked to Compact Goals • One or Two Targets per Goal Category • Some Targets are Based on Existing COG Policy Documents
Target and Indicators Categories • Land Use • Transportation • Environmental • Climate & Energy • Economy • Housing • Health & Human Services • Education • Public Safety Physical Development Economic and Social Development
draft 5-26-09 Land Use Target • The National Capital Region will capture 75% of new commercial construction and 75% [this target needs further research] of new households in regional activity centers. • Establish a no net loss of agriculture land in the National Capital Region. • Development in Regional Activity Centers • Percent of households and jobs in Regional Activity Centers • Percent of households and jobs within a ½ mile of a transit station • Green Infrastructure Acres • Agriculture land • Number of mixed-use projects • Walk Score Indicators
Transportation Target – Subject to revision draft 5-26-09 • Encourage more efficient personal travel by greatly increasing the use of transit, bike, and walk modes for both work and non-work trips. • Reduce Vehicle Miles of Travel (VMT) per capita. • Increase [Double] the regional mode shares of transit to 15%, bike to 3%, and walk to 16% and decrease the percentage [“cut in half”] of single occupancy auto trips by 2050. • Reduce Vehicle Miles Travel (VMT) per capita by 25% in 2050 below 2005 rate. • Accessibility to Jobs/Households within 45 minutes, Auto and Transit • Accessibility to non-work activities by walking and bicycling. • Emissions per vehicle mile • Commuting Mode Split • Vehicle Registration per capita • Vehicles Miles of Travel (VMT) and VMT per capita • Transit Share of work trips to Jobs in Activity Clusters • LOV, HOV and transit work trips/share Indicators
Environmental Target– Subject to revision draft 5-26-09 • The National Capital Region establishes a target of 50% of all [sentinel] watersheds will be in good or excellent condition by 2050. • The National Capital Region achieves 100% of Chesapeake Bay Goals [Water Quality Goals] by 2050. • Stream miles in good or excellent condition (% of total stream miles) • % of achievement of Chesapeake Bay Goals • Forest Coverage • Planned Wastewater treatment capacity remaining (% remaining) • Water conservation (water usage per capita) • Air quality (#of days exceeding (e.g., not meeting) federal air quality health standards) Indicators
Climate & Energy Target draft 5-26-09 • In 2050 Reduce Regional Greenhouse gas emissions by 80% below 2005 levels. • All new residential and commercial buildings constructed in the National Capital Region will be dedicated to sustainable building design and construction equivalent to LEED Certification by 2050. Indicators • Regional greenhouse gas emissions (annual) • Green building – % or square footage – of commercial and residential buildings • Energy use per capita (Natural Gas etc.)
Economic Target draft 5-26-09 • The National Capital Region will achieve and maintain a region wide target of 1.6 jobs/households ratio and an appropriate jurisdictional target that will provide an adequate supply of workers for jobs at the jurisdictional level and for the region as a whole. • The region will also achieve a reduction in poverty by steadily increasing the income levels for everyone. • The unemployment rate in the Region will be 2% below the national unemployment rate. Indicators • Median Household Income • Per capita personal income • Jobs / Households Ratio • Unemployment Rate • Gross Domestic Product (GDP) • Jobs / Households Ratio
Housing Target draft 5-26-09 • The National Capital Region and each jurisdiction will have an annual target of 15 percent of all new housing units to be affordable to low or moderate income households, or a minimum of 10% of all units affordable to those households by 2050. • 80% of new affordable units will be located in regional activity centers Indicators • Percent of Household below 80% AMI (Annual Median Income) with Housing Cost Burdens • Households located in Regional Activity Centers • Households located within a ½ mile of a transit station • Average household size
Health & Human Services Target draft 5-26-09 • The National Capital Region will promote programs and plans that provide insurance coverage and access to affordable healthcare. • The region will promote healthy communities and healthier lifestyles for everyone. Indicators • Late Pre-Natal Care (Percentage of births to mothers who reporting no prenatal care during the first 3 months of pregnancy, including those with no prenatal care.) • Obesity (Calculated percent of adults at risk for health problems related to being overweight, based on body mass index (BMI).) • Percent Uninsured, Age 18-64, by Jurisdiction
Education Target draft 5-26-09 • The National Capital Region will improve K – 12 educational programs and increase the rate [X% need target ] of students graduating from high school and decrease the drop out rate by [X% need target]. • The region will provide higher education opportunities including vocational training for all students. • Educational Attainment • % of students going to college • Literacy rate • Graduation rate • % of students going to college and graduating Indicators
Public Safety Target draft 5-26-09 • The National Capital Region will reduce the rate of violent crime by [X% need a target number] for every community by 2050. • Enhance and improve the emergency response time through out the region [based on applicable and established national standards]. Indicators • Crime Rate (Total Part 1 Offenses – Homicide, rape, robbery, aggravated assault, burglary, larceny and motor vehicle theft) • 911 Emergency Response Time (Police, Fire, & EMS) – Data not currently collected by COG.