Download
1 / 9
90 likes | 191 Views
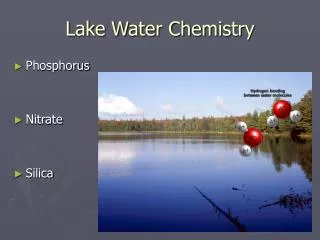
MOLTEN. Water Chemistry Database. Scope 9 sources of environmental data. >300,000 rows of chemistry data. MOLTEN. Database Structure. Metadata. Raw data. Derived data. SITES siteId site name depth country latitude & longitude. CHEMISTRY sampleId siteId date depth salinity

E N D
MOLTEN Water Chemistry Database • Scope • 9 sources of environmental data. • >300,000 rows of chemistry data.
MOLTEN Database Structure Metadata Raw data Derived data SITES siteId site name depth country latitude & longitude CHEMISTRY sampleId siteId date depth salinity TN_N ... MEANCHEMISTRY siteId salinity TN_N ... TAXA taxonId name authority SURFACEDIATOMS siteId taxonId count SURFACEDIATOMS% siteId taxonId %
MOLTEN mean NOx concentration Unadjusted 260 mg/lSeasonally adjusted 430 mg/l Environmental data problems 1. Different variables available - use lowest common denominator? 2. Are different variables comparable? - TN =f(TDN)? 3. Errors and outliers 4. Non-uniform sampling 5. Data not available for entire period required
Distribution of variables across all datasets 50 120 100 40 100 150 80 80 30 60 100 60 20 40 40 50 10 20 20 0 0 0 0 0 20 40 60 80 8 10 12 14 0 10 20 30 0 100 200 300 400 depth temperature salinity PO4.P 200 150 100 150 150 80 100 100 60 100 40 50 50 50 20 0 0 0 0 0 200 400 600 0 1000 2000 3000 4000 5000 0 500 1000 1500 2000 0 1000 2000 3000 4000 TP NOx.N NH4.N TN 60 150 100 80 40 100 60 40 20 50 20 0 0 0 0 2000 4000 6000 0 50 100 150 0 2 4 6 8 10 12 14 SiO3.Si chlorophyll.a secchi
30 1.5 25 20 1.0 log depth salinity 15 0.5 10 5 0.0 0 all fi sw dk ho all fi sw dk ho Box plots of variables in datasets 2.5 2.0 log PO4.P 1.5 1.0 0.5 all fi sw dk ho 3.6 2.5 3.0 2.5 log TP 3.2 log TN 2.0 log NOx.N log NH4.N 2.0 1.5 2.8 1.5 1.0 0.5 2.4 all fi sw dk ho all fi sw dk ho all fi sw dk ho all fi sw dk ho 1.0 2.0 3.5 1.5 0.5 3.0 log chlorophyll.a log secchi log SiO3.Si 1.0 0.0 2.5 0.5 -0.5 0.0 2.0 all fi sw dk ho all fi sw dk ho all fi sw dk ho
MOLTEN Chemistry Results Summer NOx depletion Spring/summer PO4x depletion
Conclusions • Cleaning and normalisation was necessary • Wide range of environments represented • Seasonal patterns give insite to processes • Potential for papers?