Download
1 / 16
160 likes | 268 Views
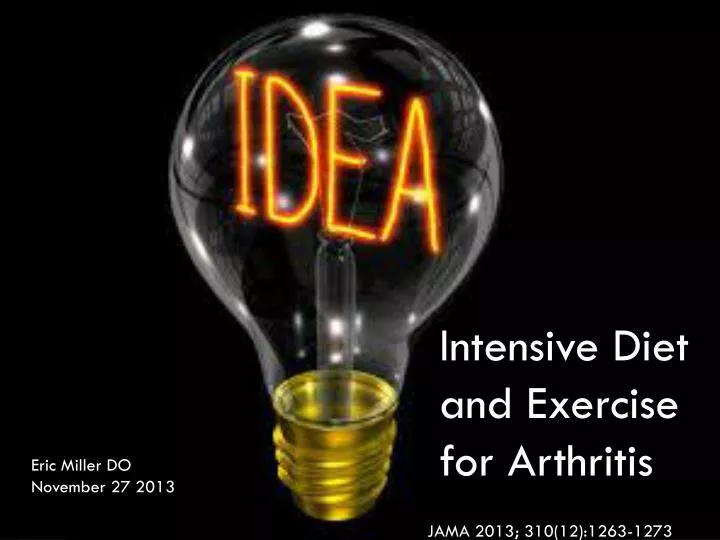
Intensive Diet and Exercise for Arthritis. Eric Miller DO November 27 2013. JAMA 2013; 310(12):1263-1273. Osteoarthritis. Leading cause of disability among older adults Knee Most frequent cause of mobility dependency and diminished quality of life Obesity is major risk factor

E N D
Intensive Diet and Exercise for Arthritis Eric Miller DO November 27 2013 JAMA 2013; 310(12):1263-1273
Osteoarthritis • Leading cause of disability among older adults • Knee • Most frequent cause of mobility dependency and diminished quality of life • Obesity is major risk factor • Pharmaceutical treatment only yields 30% improvement in half of patients • Destruction by both biomechanical and pro-inflammatory factors
Methods • Single center, blinded, Randomized Control Trial • 18 months • 3 groups • Diet • Exercise • Diet & Exercise • Results • Knee joint compressive force • IL-6 • Clinical outcomes (pain, function, mobility and health related quality of life
Demographics • 55 or older • Community dwelling • Kellgren-Lawerence grade 2-3 (mild-moderate) radiologic • Pain on most days • BMI 27-41, 79.3% >30 • Sedentary • < 30 minutes per week of formal exercise in the last 6 months • 454 included • 88% completed
Weight Loss Intervention • Goal 10%, weight loss range 10-15% • Diet • 2 meal replacement shakes • 3rd meal weekly menu plan 500-750 kcal • 15-20% protein • Less than 30% fat • 45-60% carbohydrates • Plan for 800-100 kcal/day deficit • Minimum 1100 kcal ♀ and 1200 kcal ♂ • Weekly or biweekly monitoring • Nutritional education sessions
Exercise Intervention • 1 hour • 3 days a week • 6 months center based • Afterward • Home program • Center based • Combination • 15 minute aerobic walking • 20 minute strength training • 15 minute 2nd aerobic phase • 10 minute cool down
Diet & Exercise Intervention • Trained using behavioral techniques • Social cognitive theory • Group dynamics • Additional counseling as needed
Measurements • Baseline, 6 months, 18 months • Tibiofemoral compressive force • Blood sample 10 hour fast in D&E and E groups for IL-6 • WOMAC for self reported pain • SF-36 for HRQL • Weight • Height • BMI • Gait speed
Analysis • Primary Outcomes • IL-6 • Knee compressive force • Secondary Outcomes • WOMAC pain & function • SF-36
Results • Diet and Diet & exercise lost significantly more weight than exercise p<.001 • Diet -9.5% • D&E -11.4% • Exercise -2% • Knee Load • Diet -10% p=.007 95% CI • D&E -9% • Exercise -5% • IL-6 p=.008 • D p=.006 • D&E p=.007
Results cont. • Pain and Function • D&E • 38% very little to no pain vs. 20-22% • Vs. E p=.004 • Vs. D p=.001 • Function • Vs. E p<.001 • Vs. D p=.005 • Mobility and HRQL • Gait D&E vs. E • 0.04m/s faster p=.003 • Distance D&E • Vs. E 21.3m p=.005 • Vs. D 41.5m p<.001 • Distance E vs. D • 20.2m p=.009 • SF-36 • Physical D&E vs. E 2.81 units p=.005 • Mental subscale no significant difference
Figure Legend: Mean WOMAC Pain Scores Across the 18-Month Intervention PeriodThe Western Ontario and McMaster Universities Osteoarthritis Index (WOMAC) pain subscale was used to measure self-reported pain while performing daily living activities in the last 48 hours due to knee osteoarthritis. Total scores range from 0 to 20; higher scores indicate greater pain. The estimates are based on the previously stated number of observations and multiply imputed values for the missing observations within each group adjusted for baseline body mass index, sex, and baseline values. P = .002 comparing the diet + exercise group with the diet group and exercise group. Error bars indicate 95% CIs.
Results cont. • Weight change had significant dose response to: • Knee compressive force • IL-6 level • Pain & function • Weight loss greater in D&E and D vs. E • Primary Outcomes • Knee force decreased in all groups • IL-6 D&E and D improved vs. E