Download
1 / 1
10 likes | 105 Views
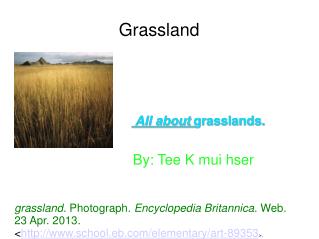
Explore how MODIS imagery helps model grassland phenological responses to climate variability in Laramie Basin. The study aims to reveal insights for ranching, drought prediction, and wildfire risk assessment.

E N D
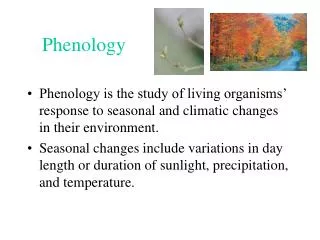
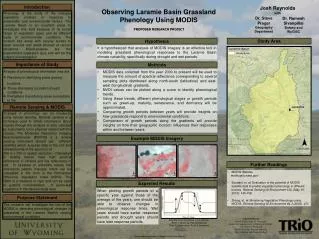
Josh Reynoldswith Introduction Phenology is the study of the changes organisms undergo in response to seasonality and environmental factors. The Laramie Basin is an excellent place to investigate this field because of its broad range of vegetation types and its different types of environmental conditions. The location has areas with varying access to water sources and areas situated at various elevations. Mixed-grasses are the predominant vegetation type and will be the subject of investigation. Dr. Ramesh Sivanpillai Botany and WyGISC Dr. Steve Prager Geography Department Observing Laramie Basin Grassland Phenology Using MODIS PROPOSED RESEARCH PROJECT Study Area Hypothesis It is hypothesized that analysis of MODIS imagery is an effective tool in modeling grassland phenological responses to the Laramie Basin climate variability, specifically during drought and wet periods. Importance of Study Methods • Analysis of phenological information may aid: • Ranchers in identifying prime grazing locations • Those attempting to predict drought conditions • Firefighters in predicting areas susceptible to fire • MODIS data collected from the year 2000 to present will be used to measure the amount of spectral reflectance corresponding to several sampling plots distributed along north-south (latitudinal) and east-west (longitudinal) gradients. • NVDI values can be plotted along a curve to identify phenological trends. • Using these trends, different phenological stages or growth periods such as green-up, maturity, senescence, and dormancy will be approximated. • Comparing growth periods between years will provide insights on how grasslands respond to environmental conditions. • Comparison of growth periods along the gradients will provide insights on how their geographic location influences their responses within and between years. Remote Sensing & MODIS Changes in phenology can be measured using remote sensing. Remote sensing is a technique used to obtain information about objects through the analysis of data collected by instruments not in physical contact with the objects. The Moderate Resolution Imaging Spectroradiometer (MODIS) is a remote sensing instrument aboard two different satellites which acquires data in the red and infrared bands of the spectrum at 250 m x 250 m spatial resolution. Chlorophyll in healthy leaves have high spectral reflectance in infrared and low reflectance in red. In stressed or unhealthy leaves this reflectance pattern changes, which can be calculated in the form of the Normalized Difference Vegetation Index (NDVI). The NDVI is a measure of vigor and can be used to quantify concentrations of green-leaf vegetation in the desired study area. Example MODIS Imagery Further Readings • MODIS Website • modis.gsfc.nasa.gov/ • Soudani, et. al: Evaluation of the potential of MODIS satellite data to predict vegetation phenology in different biomes. Remote Sensing Of Environment 132, (May 15, 2013): 145-158. • Zhang, et. al:Monitoring Vegetation Phenology using MODIS. Remote Sensing Of Environment 84.3 (2003): 471. Expected Results When plotting growth periods of a specific year against those of the average of the years, one should be able to observe changes in phenological response times. Wet years should have earlier response periods and drought years should have later response periods. Purpose Statement This research will investigate the use of the MODIS in detecting phenological changes in grasslands in the Laramie Basin’s varying environmental conditions. Example of growth period curve (Zhang). Point 1: Green-up, Point 2: Maturity Point 3: Senescence, Point 4: Dormancy Acknowledgments Steven Prager, Dept. of Geography Ramesh Sivanpillai, Dept. of Botany & WyGISC University of Wyoming McNair Scholars Program and Staff Zackie Salmon and Susan Stoddard Background image courtesy of Snowbird Homes and Land, Inc.