Download
1 / 38
380 likes | 552 Views
LPS Applied Analytics: Trends in Mortgage and Housing. Presented to the Mortgage Bankers Association of Jacksonville. August prepayment rates hit the highest levels since 2005. High LTV non-government originations are up over 75% YTD.

E N D
LPS Applied Analytics: Trends in Mortgage and Housing Presented to the Mortgage Bankers Association of Jacksonville
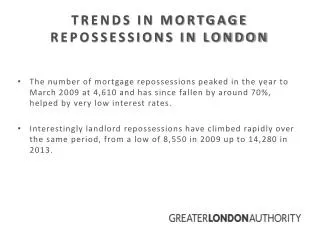
In Florida, high LTV non-government originations have more than tripled
High LTV prepayment rates in Florida are lower than national
Fewer than 30% of 2007 and prior vintages remain active and current
Despite historically low rates, origination activity is still limited
Florida origination activity has increased over the last six months
“30,000 foot view”: Delinquencies are improving, foreclosures still near highs Over 3 MM loan mods House prices drop 20% House prices peak Fed rate intervention
From 2005 to 2009 the crisis spread nationwide, impacting all regions
The State of the Union today: Regional improvementbut still trouble spots
Non-judicial states have experienced greater improvement Non-Judicial: Down 31% from peak Washington, NJ and Vermont are still at historic highs Judicial: Down 13% from peak Few non-judicial states remain close to peak levels
Even where improvement is evident, magnitude varies Total non-current in Lee County was 1.4x of Jacksonville MSA at the peak
On average, Jacksonville modification rates have been higher than FL & US
Florida foreclosure starts outnumber sales by almost 3:1 over last 12 months
First-time starts lowest since ’08; repeat foreclosure rate at new high
70% of FL foreclosure starts were “repeats”; first time at multi-year lows
Foreclosure inventory in Florida has declined, but still extremely high
The average loan in foreclosure is 622 days past due (ex FL, NY and NJ) Excluded from Average Florida = 932 New Jersey = 934 New York = 953
Timelines are long nation-wide, but judicial states are 1.4x non-judicial
Foreclosure timelines vary significantly within states Over 1 year timeline difference The average loan in foreclosure in Florida is over 2.5 years past due
Foreclosure sale activity is driven by regional processes and restrictions
Judicial and other legal actions have had significant effects on pipelines
With more distressed homes on the market, price pressure may continue
“30,000 foot view” (HPI Edition): Some signs of stabilization Collapse of non-agency market Home buyer tax credit expiration Easy credit, affordability products Fed rate intervention Long term trend?
The FL bubble was muted in JAX; local home prices down more than US
National REO and short sales prices are about 75% of non-distressed
REO discount in FL was lower than that of short sale for the first time
Negative equity and new problem loan correlation is clear by geography
Relative price stability has supported improvement in new problem loans House prices peak House prices drop 20%
Further house price declines could lead to more new problems
Whatdata are out there? BORROWER LOAN PROPERTY LOAN LEVEL DATA PUBLIC RECORDS LOSS MIT HPI CREDIT BUREAU DATA McDash Loan Data + Modules