Data Mining in Bioinformatics
310 likes | 589 Views
Data Mining in Bioinformatics. Outline. Introduction Overview of Microarray Problem Image Analysis Data Mining Validation Summary. Introduction: Recommended Literature. 1. Bioinformatics – The Machine Learning Approach by P. Baldi & S. Brunak, 2 nd edition, The MIT Press, 2001

Data Mining in Bioinformatics
E N D
Presentation Transcript
Outline • Introduction • Overview of Microarray Problem • Image Analysis • Data Mining • Validation • Summary
Introduction: Recommended Literature 1. Bioinformatics – The Machine Learning Approach by P. Baldi & S. Brunak, 2nd edition, The MIT Press, 2001 2. Data Mining – Concepts and Techniques by J. Han & M. Kamber, Morgan Kaufmann Publishers, 2001 3. Pattern Classification by R. Duda, P. Hart and D. Stork, 2nd edition, John Wiley & Sons, 2001
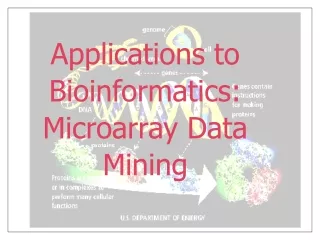
Introduction: Microarray Problem in Bioinformatics Domain • Problems in Bioinformatics Domain • Data production at the levels of molecules, cells, organs, organisms, populations • Integration of structure and function data, gene expression data, pathway data, phenotypic and clinical data, … • Prediction of Molecular Function and Structure • Computational biology: synthesis (simulations) and analysis (machine learning)
Microarray Problem: Major Objective • Major Objective: Discover a comprehensive theory of life’s organization at the molecular level • The major actors of molecular biology: the nucleic acids, DeoxyriboNucleic acid (DNA) and RiboNucleic Acids (RNA) • The central dogma of molecular biology Proteins are very complicated molecules with 20 different amino acids.
Input and Output of Microarray Data Analysis • Input: Laser image scans (data) and underlying experiment hypotheses or experiment designs (prior knowledge) • Output: • Conclusions about the input hypotheses or knowledge about statistical behavior of measurements • The theory of biological systems learnt automatically from data (machine learning perspective) • Model fitting, Inference process
Overview of Microarray Problem Biology Application Domain Validation Data Analysis Microarray Experiment Image Analysis Data Mining Experiment Design and Hypothesis Data Warehouse Artificial Intelligence (AI) Knowledge discovery in databases (KDD)
Artificial Intelligence (AI) Community • Issues: • Prior knowledge (e.g., invariance) • Model deviation from true model • Sampling distributions • Computational complexity • Model complexity (overfitting) Collect Data Choose Features Choose Model Train Classifier Evaluate Classifier Design Cycle of Predictive Modeling
Data Mining and Image Analysis Steps • Image Analysis • Normalization • Grid Alignment • Feature construction (selection and extraction) • Data Mining • Statistics • Machine learning • Pattern recognition • Database techniques • Optimization techniques • Visualization • Prior knowledge • Validation • Issues • Cross validation techniques ?
Image Analysis: Normalization Dynamic range of red band Red Band Green Band Dynamic range of green band Solution: Reference points with reference values
Image Analysis: Grid Alignment Solution: Manual, semi-automatic and fully automatic alignment based on fiducials and/or global grid fitting.
Image Analysis: Feature Selection Features: mean, median, standard deviation, ratios Area: Sensitive to background noise
Image Analysis: Feature Extraction • Area is determined by image thresholding and used during feature extraction 1102 Dist: 2004 Box: 902 Plane: 2632
Why Data Mining ? Sequence Example • Biology: Language and Goals • A gene can be defined as a region of DNA. • A genome is one haploid set of chromosomes with the genes they contain. • Perform competent comparison of gene sequences across species and account for inherently noisy biological sequences due to random variability amplified by evolution • Assumption: if a gene has high similarity to another gene then they perform the same function • Analysis: Language and Goals • Feature is an extractable attribute or measurement (e.g., gene expression, location) • Pattern recognition is trying to characterize data pattern (e.g., similar gene expressions, equidistant gene locations). • Data mining is about uncovering patterns, anomalies and statistically significant structures in data (e.g., find two similar gene expressions with confidence > x)
Data Mining Techniques Visualization
Statistics Statistics Descriptive Statistics Inductive Statistics Make forecast and inferences Describe data Are two sample sets identically distributed ?
Machine Learning Machine Learning Unsupervised Supervised “Natural groupings” Reinforced Examples
Pattern Recognition Pattern Recognition k-nearest neighbors, support vectors Locally Weighted Learning Statistical Models Linear Correlation and Regression Decision Trees Neural Networks NN representation and gradient based optimization NN representation and genetic algorithm based optimization
Database Techniques • Database Design and Modeling (tables, procedures, functions, constraints) • Database Interface to Data Mining System • Efficient Import and Export of Data • Database Data Visualization • Database Clustering for Access Efficiency • Database Performance Tuning (memory usage, query encoding) • Database Parallel Processing (multiple servers and CPUs) • Distributed Information Repositories (data warehouse) MINING
Optimization Techniques • Highly nonlinear search space (global versus local maxima) • Gradient based optimization • Genetic algorithm based optimization • Optimization with sampling • Large search space • Example: A genome with N genes can encode 2^N states (active or inactive states, regulated is not considered). Human genome ~ 2^30,000; Nematode genome ~ 2^20,000 patterns.
Visualization • Data: 3D cubes,distribution charts, curves, surfaces, link graphs, image frames and movies, parallel coordinates • Results: pie charts, scatter plots, box plots, association rules, parallel coordinates, dendograms, temporal evolution Parallel coordinates Pie chart Temporal evolution
Prior Knowledge from Experiment Design Complexity Levels of Microarray Experiments: • Compare single gene in a control situation versus a treatment situation • Example: Is the level of expression (up-regulated or down-regulated) significantly different in the two situations? (drug design application) • Methods: t-test, Bayesian approach • Find multiple genes that share common functionalities • Example: Find related genes that are dependent? • Methods: Clustering (hierarchical, k-means, self-organizing maps, neural network, support vector machines) • Infer the underlying gene and protein networks that are responsible for the patterns and functional pathways observed • Example: What is the gene regulation at system level? • Directions: mining regulatory regions, modeling regulatory networks on a global scale Goal of Future Experiment Designs:Understand biology at the system level, e.g., gene networks, protein networks, signaling networks, metabolic networks, immune system and neuronal networks.
Types of Expected Data Mining and Analysis Results • Hypothetical Examples: • Binary answers using tests of hypotheses • Drug treatment is successful with a confidence level x. • Statistical behavior (probability distribution functions) • A class of genes with functionality X follows Poisson distribution. • Expected events • As the amount of treatment will increase the gene expression level will decrease. • Relationships • Expression level of gene A is correlated with expression level of gene B under varying treatment conditions (gene A and B are part of the same pathway). • Decision trees • Classification of a new gene sequence by a “domain expert”.
Why Validation? • Validation type: • Within the existing data • With newly collected data • Errors and uncertainties: • Systematic or random errors • Unknown variables - number of classes • Noise level - statistical confidence due to noise • Model validity – error measure, model over-fit or under-fit • Number of data points - measurement replicas • Other issues • Experimental support of general theories • Exhaustive sampling is not permissive
Cross Validation: Example • One-tier cross validation • Train on different data than test data • Two-tier cross validation • The score from one-tier cross validation is used by the bias optimizer to select the best learning algorithm parameters (# of control points) . The more you optimize the more you over-fit. The second tier is to measure the level of over-fit (unbiased measure of accuracy). • Useful for comparing learning algorithms with control parameters that are optimized. • Number of folds is not optimized. • Computational complexity: • #folds of top tier X #folds of bottom tier X #control points X CPU of algorithm
Summary • Microarray problem • Computational biology • Major objective of microarray technology • Input and output of data analysis • Data mining and image analysis steps • Image normalization, grid alignment, feature construction • Data mining techniques • Prior knowledge • Expected results of data mining • Validation • Issues • Cross validation techniques