Assessment of Soccer Referee Proficiency in Time-Sensitive Decision-Making
This study evaluates the efficacy of soccer referees in making timely decisions critical for maintaining game integrity. With 96% of junior referees in the Metro DC Virginia State Referee Program lacking proper assessments in fitness and game flow understanding, it proposes a cost-effective method to enhance referee accuracy. Utilizing a refined simulation model, we analyze the call accuracy of referees based on their fitness and game flow understanding levels, providing insights into training needs and decision-making improvements for junior referees.

Assessment of Soccer Referee Proficiency in Time-Sensitive Decision-Making
E N D
Presentation Transcript
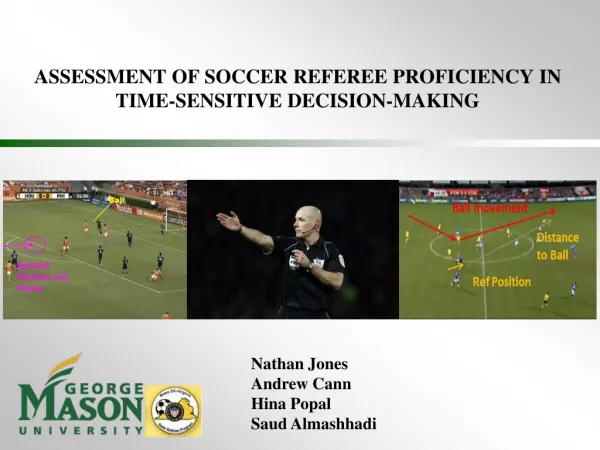
ASSESSMENT OF SOCCER REFEREE PROFICIENCY IN TIME-SENSITIVE DECISION-MAKING Nathan Jones Andrew Cann Hina Popal Saud Almashhadi
Context Problem & Need Statement Design Alternatives Simulation Simulation Output Utility Analysis Conclusions Management Agenda
Introduction to Soccer • Soccer is the world’s most popular sport. • Generates the most revenue: • In 2009-2010 season the English Premier League generated roughly 3.2 billion dollars • European soccer generated 21.6 billion dollars • Highest average attendance for international club competitions: • FIFA World Cup • UEFA Champions League Information taken from: http://www.economist.com/blogs/gametheory/2011/09/ranking-sports%E2%80%99-popularity
Introduction to Soccer • The game is played by two teams (11 vs. 11). • Field dimensions: • 115 by 74 yards • 2 – 45 minute periods • 3 Referees – 1 main referee and 2 assistant referees • Responsible for upholding the integrity of the game AR MR AR
Referee Responsibilities • Upholding the integrity of the game: • Make accurate calls • Make calls that don’t interrupt the flow of the game • Be in proper position, to assess, process, and identify correct call • Current MLS referees make 86.1 % correct calls. (USSF) Referees are categorized as either junior referees (entry level) or senior referees (advanced level).
Acknowledgement of Sponsor Responsibilities 2 and 3 depend heavily on ability to assess referee call accuracy • Metro DC Virginia State Referee Program (MDCVSRP) oversees all soccer referees in the Commonwealth of Virginia (over 5400 referees) • Responsibilities: • Train and evaluate junior and senior referees • Assign Referees to officiate games • Promote high quality referees to senior ranks
Referee Assessment Written Exam on Knowledge of the Game On-Field Assessments Fitness Test
Referee Assessment is Broken • Junior referees do not undergo fitness tests or on field assessments • (Preventing evaluation of Fitness or GFU attributes) • The evaluation process for referees is broken: • 96% of total MDCVSRP Referees (junior level) do not receive assessment in two of three attributes.
Context Problem & Need Statement Design Alternatives Simulation Simulation Output Utility Analysis Conclusions Management Agenda
Problem Statement 96 % of MDCVSRP referees (Junior level) do not receive assessment for Game Flow Understanding and fitness attributes as predictors of call accuracy.
Need Statement An assessment method is needed to evaluate referee accuracy in a cost effective manner utilizing fitness and/or Game Flow Understanding (GFU). Scope: Our analysis will focus on determining the best system concept for assessing MDCVSRP junior referees. Specifics of design and implementation are considered future work.
Context Problem & Need Statement Design Alternatives Simulation Simulation Output Utility Analysis Conclusions Management Agenda
Design Alternatives Costs defined as physical + implementation cost for one time evaluation of all junior referees.
Evaluation Of Alternatives • Utility of each alternative defined as: • Expected call accuracy of the top 100 referees identified using each alternative within junior referee pool (5000 referees). • To determine utilities, a two part analysis was conducted: • Function for call accuracy based on fitness and GFU levels developed using discrete soccer game simulator. • Using part 1 function, expected call accuracy of top 100 referees selected by each alternative computed through Monte Carlo analysis.
Context Problem & Need Statement Design Alternatives Simulation Simulation Output Utility Analysis Conclusions Management Agenda
Expansion on Prior Work Simulation was re-designed and re-coded from scratch.
Simulation – Ball and Referee Position 8510 cells Each Cell 1x1 yd • Cell Groupings: • 60 Movement • Polygons • 24 Call Grids • 0.5 s refresh rate (game time) • In the discrete event simulation, a soccer field is divided into a fine grid of cells.
Two Teams - Possession Shifts The ball shifts possession between two different teams, each executing its own unique strategy . Changes in possession occur due to failed passes or shot events.
Ball & Referee Movement Algorithm • At any time in simulation, ball moving to set destination in straight line. • Destination changes during dribbling / passing. • Time taken for ball to move incrementally to destination (# Refreshes) is reflective of ball speed and distance:
Shot Events Whenever ball finishes dribbling, probability determines if ball is shot at goal. Shot either results in goal or turnover.
Pass Events • Manchester United • Arsenal • Wigan Athletic • Stoke City • If no shot, Ball passed between polygons controlled by movement probability maps indicating destination and chance of success. • Polygon (n+1) = Polygon (n) * Prob. Map • When new polygon selected, destination is set to random cell within polygon • Map sets are • formulated for:
Probability Maps Data was analyzed for strategy and used to produce shot and movement probability maps • Ball movement and shot data were gathered from the Guardian Chalkboard Website. 80 total games (over 35,000 pass & shot events) recorded for Stoke City, Manchester United, Arsenal, Wigan.
Probability Maps – Team Strategy Strategy Analysis conducted to determine when strategy maps should be changed (Metric = % completed passes) • Two way ANOVA Analysis: Time + Score + Time*Score • Time has an effect on pass accuracy: • Arsenal(p = 0.777); United(p=0.142); Stoke (p=0.001); Wigan (p=0.001) • Score has an effect on pass accuracy: • Arsenal(p = 0.231);United(p=0.001);Stoke(p=0.000); Wigan (p=0.000) • Score*Time has an effect on pass accuracy: • Arsenal(p = 0.338);United(p=0.000);Stoke(p=0.000);Wigan(P= 0.116)
Referee Profile Definition Referee Game Flow Understanding Referee Fitness • To determine the effect of Fitness and Game Flow Understanding on call performance: • 25 referee “profiles” defined as combinations of fitness and game flow understanding.
Simulation – Ref movement One main referee running within left hand diagonal route area. Referee movement speed depends on fitness level of profile tested.
Simulation - Ref Movement Once destination is set, referee will begin moving to destination (rate = speed). Process repeats at each refresh At each refresh rate (0.5 s), referee will compute desired location relative to ball using one of 2 movement scripts: No Prediction – Referee will set destination to closest cell within 11 – 13 yds of ball’s current location. 2) Prediction– If dribbling: Referee will set destination to closest cell within 11 – 13 yds of next most probable pass destination.
Simulation – Ref Movement GFU also includes an ability of referee to recognize a build up to a call: Probability that predicting referee anticipates the call and switches to script 1 until the call occurs. • Proportion of time referee utilizes script 2 depends on GFU level. • Referee with (GFU = 0.75) with remain in script 2 75% of time.
Call Events Roughly 90 events per game Passing: 0.21 Dribbling: 0.44 En-route: 0.15 Receiving: 0.21 • Call grid probabilities used to generate events based on ball location whenever new cycle begins. Further probabilities determine where in cycle event occurs. • Source: Senior MDCVSRP referee surveys (n = 16)
Simulation - Call Accuracy • Whenever a call event occurs, referee must make a decision regarding the nature of the event (infraction, no infraction). • The probability that he makes the correct call depends on the distance from the ball.
Referee Call Accuracy Function • Source: Senior MDCVSRP referee surveys (n = 16) Distance <= 20 yds Distance > 20 yds Accuracy Peaks at 11 – 13 yds
Simulation - Output • Simulation output : • Each profiles simulated through 2,000 games (200 per team comb.) • Referee call accuracy was calculated for each game.
Validation of Simulator [1] - http://soccernet.espn.go.com/stats/_/league/eng.1/year/2010/barclays-premier-league?cc=5901 [2] - http://www.whoscored.com • [3] - D.R.D. Mascarenhas et al. (2009) "Physical Performance and Decision Making in Association Football Referees: A Naturalistic Study" [online]. Available: http://www.benthamscience.com/open/tossj/articles/V002/1TOSSJ.pdf
Context Problem & Need Statement Design Alternatives Simulation Simulation Output Utility Analysis Conclusions Management Agenda
Simulation - Call Accuracy Results Average 2000 games per profile
Simulation Results - Regression R-Sq = 99.51% Fitness, GFU nonlinear No interaction (p = 0.813) Accuracy (Fitness, GFU): 0.713491 + 0.000923486 *Fitness + 1.28791e-005*GFU 6.4846e-005*Fitness^2 + 1.12504e-006*GFU^2 + 1.26193e-006*Fitness^3- 6.75305e- 009*Fitness^4
Context Problem & Need Statement Design Alternatives Simulation Simulation Output Utility Analysis Conclusions Management Agenda
Defining Referees for Utility Analysis Call accuracy for each referee defined using Call Accuracy Regression • Referees are defined as a combination of two independent traits (Fitness, GFU) • Each trait is scaled from worst (0) to best (100) possible • The distribution of referees for each trait is Normal at mean 50 and st. dev 15
Utility Analysis Method – Monte Carlo Alternatives assumed to have perfect ability to identify if referees make the cutoff • 5000 Referees (Junior level) were generated . • For each alternative, a cutoff was defined on each attribute assessed where if a referee preformed above the cutoff on all attributes, he would be selected by program. • Cutoff developed using Normal CDF to ensure top 100 referees selected
Analysis Method – Monte Carlo • For each alternative, referees are identified that meet the selection cutoff. • The average call accuracy of referees selected (% correct calls) is used to determine alternative utility.
Utility Analysis Results Based on n = 30 trials
Context Problem & Need Statement Design Alternatives Simulation Simulation Output Utility Analysis Conclusions Management Agenda
Alternative Cost vs. Benefit “Fitness Test” dominates all other assessment based alternatives.