Download
1 / 25
250 likes | 345 Views
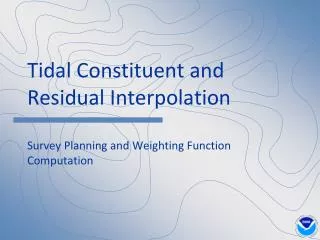
TCARI is a software tool for tidal constituent interpolation, survey planning, and data analysis. Save, load, clean shoreline data, and interpolate tidal datum offsets to optimize survey results with weighting functions and harmonic analysis.

E N D
Tidal Constituent and Residual InterpolationSurvey Planning and Weighting Function Computation
Clarendon Fort Pulaski
TCARI Lat1 Lat2 –Lon1 –Lon2 Results (36) in file Lat1 Lat2 –Lon1 –Lon2 (Saved on every ones C:\TCARI) Stations with Accepted Datums and Either Working or Accepted Harmonic Constituents in DMS Excel
Station Identification Station Datums Station Harmonic Constituents
Data Inventory Harmonic Analysis (29d or 365d) Store Constituents Store Constituents Retrieve Local Results
Loading and Cleaning Shoreline • Load Shoreline. • Close off all open shoreline • Create ocean boundary • Find bad segments • Jump to bad segments to • clean each one. Bad shoreline point Create ocean boundary Close all open segments Clean Shoreline (Find Bad Segments)
Create Triangulated Mesh Some stations fall outside of the shore- line. You can move then inside the shore- line by adjusting the lat/lon. If they are not inside, they will not get used. Triangulated Mesh
1500m Clarendon station radius increased to 3500m
Weights for Skull Creek 8669133 1500m 100% 80% 70% 60% 50% 40% 8669133 30% 10% 0%
Interpolated datum offsets
Weighting Percentages for harmonic constituents
Weighting percentages for residuals Fort Pulaski Weighting percentages for residuals Clarendon
If Clarendon were to drop out, can you just use Fort Pulaski? Differences up to ~0.4m
Error Estimation Fort Pulaski and Clarendon Analysis shows that Clarendon needs to be operating during the time of the survey.
Tide Station Info Two stations are in and operating. The rest are all historic stations that can be used for harmonics and datums Only check “Solve Combinations” if your analysis shows that it is acceptable for an operating gauge to drop out.
Spot Checking for Final Analysis Comparing TCARI results against our Traditional discrete zoning • Load verified 6-minute water level data into TCARI • Review WL Graphs (Show water level graphs) 3. Choose a spot in the grid, a landmark, buoy, or other feature. Show Tide Corrector
TCARI Project Instructions TCARI Field SOP Delivered with every set of Project Instructions