Download
1 / 15
150 likes | 266 Views
Renewable Portfolio Standard in Massachusetts. Alan Nogee Energy Program Director Union of Concerned Scientists www.ucsusa.org anogee@ucsusa.org Massachusetts Restructuring Roundtable Boston, MA October 19, 2001. Process.

E N D
Renewable Portfolio Standard in Massachusetts Alan Nogee Energy Program Director Union of Concerned Scientists www.ucsusa.org anogee@ucsusa.org Massachusetts Restructuring Roundtable Boston, MA October 19, 2001
Process • DOER did excellent job analyzing technical issues in detailed white papers - created national resource • Advisory process helped flesh out issues, move toward consensus • Closure long overdue • Adverse effect on market
Standard offer and default service • Failure to include would have rendered RPS meaningless • Barrier to competition • No suggestion or discussion of exclusion during three years of debate • How would proposal to create barrier to competition have been received when RPS proposed?
Flexibility mechanisms • Certificates • reliance on regional comprehensive Generator Information System avoids need to create MA renewable credits • True up period • Banking and early compliance
Product compliance • Consistent with disclosure regulations • Essential to integrity of green market offering customer something they would not have received anyway
Existing renewables • Not consistent with language - “an additional” 1% of sales by 2003 • Puts existing renewable generation at risk • Any size hydro = “naturally flowing”
Biomass definition • Case-by-case determination of other technologies (fluidized bed) unworkable • Administrative nightmare • Creates uncertainty about availability and costs of resources - could paralyze investment • “Advanced technology such as gasification” adopted when gasification appeared around corner • Consider • emission-based standard = best MA generator • fluidized bed a transitional technology - could allow for period of time or until 2 or more gasification units or X MW operating in region
? ?? Other issues • Compliance mechanism (cost cap) • reasonable policy but unclear legal authority • UCS will not challenge if other provisions unchallenged • Needs commitment from MTC to maintain integrity of certificates approach to maximum extent possible • Additional mechanisms create uncertainty • Consider strengthening or eliminating • Imports - balance between resource availability and MA environmental benefits • Contract path compliance may undermine integrity of GIS. How to ensure backup if GIS not implemented in time but maintain integrity? • RPS end date. Needs to be clear DOER decision about increasing, but will not decrease
MA RPS regulations • MA RPS passed November 1997 • Presentation on regulations in April 1999 • RPS had not passed in Texas • Texas RPS passed in June 99 • January 00 - Texas regulations finalized • January 02 - MA regulations finalized?
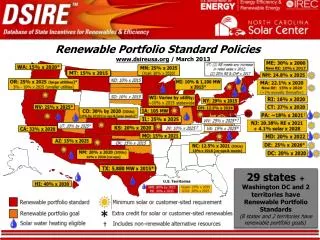
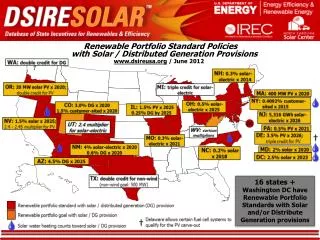
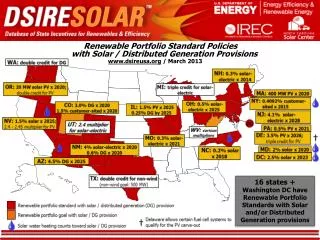
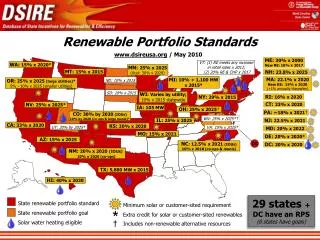
Renewable energy standards • 12 states - WI, IA, MN, NV outside of restructuring • CA very close - 20% by 2010 ME: 30% by 2000 MN: 3.6% by 2002 and 4.8% by 2012 WI: 2.2% by 2011 MA: 11% by 2009 NV: 15% by 2013, half solar CT: 13% by 2009 NJ: 6.5% by 2012 PA: varies by utility IA: 2% by 1999 AZ: 1.1% by 2007, 60% solar NM: 5% of standard offer TX: 2.2% by 2009
Clean Energy Blueprint • Renewable portfolio standard 20% by 2020 • Production tax credits • Net metering • Public benefit fund - 2 mills - $1/month • Energy efficiency and renewables R&D • Efficiency standards and building codes • Efficiency tax incentives • Combined heat and power incentive
Electricity generationClean Energy Blueprint vs. Business as Usual Electricity Generation and Efficiency under the Clean Energy Blueprint Electricity Generation under Business as Usual
Power plant carbon emissionsClean Energy Blueprint CO2 reduced 60% from business as usual
Power plant SO2 and NOx emissionsClean Energy Blueprint SO2 and NOx reduced 55% from business as usual
200 180 Incremental Costs 160 Energy Bill Savings 140 120 Billion 1999$ 100 80 60 40 20 0 2002 2004 2006 2008 2010 2012 2014 2016 2018 2020 Investment costs and energy bill savingsClean Energy Blueprint Net savings reach $105 billion per year in 2020 Cumulative savings = $440 billion