Download

1 / 72
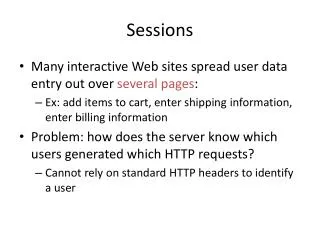
730 likes | 878 Views
Sessions of Interest. Code Analysis Tools. September 28 – October 2, 2014 San Francisco. For Achieving Consistent, Secure and Reliable Product Quality. Sheldon Lobo Oracle Solaris Studio Jared Smolens Microelectronics. Outline. Tools introduction SPARC Simulator Case Study

E N D
Code Analysis Tools September 28 – October 2, 2014 San Francisco For Achieving Consistent, Secure and Reliable Product Quality Sheldon LoboOracle Solaris Studio Jared Smolens Microelectronics
Outline Tools introduction SPARC Simulator Case Study OpenSSL Heartbleed Wrap-up 1 2 3 4
Oracle Solaris Studio #1 Development Tool Suite for Oracle Systems Compiler Suite C, C++ Compiler Visual Debugger Performance Library Fortran Compiler Analysis Suite Performance Analyzer Code Analyzer Thread Analyzer IDE
Oracle Solaris Studio #1 Development Tool Suite for Oracle Systems Compiler Suite C, C++ Compiler Visual Debugger Performance Library Fortran Compiler Analysis Suite Performance Analyzer Code Analyzer Thread Analyzer IDE
What is the Code Analyzer Code Analyzer Tools Previse • Source code analysis Discover • Runtime memory analysis • Memory leak detection Uncover • Code coverage Supported Interfaces CLI GUI IDE
The Studio 12.4 Code Analyzer is better • Tightly integratedwith the Studio compiler, tools, and IDE. • Reliable • In sync • Backwards compatible • Fast • No additional configuration • Debugable • Binary based, no recompilation. • Compare and/or accumulate multiple run results. • Customizable via the parseable results format. • Free!
Outline Tools introduction SPARC Simulator Case Study OpenSSL Heartbleed Wrap-up 1 2 3 4
SPARC Processor Model Overview Internal simulation tool for designing and analyzing next-generation SPARC CPUs 440,000+ lines of C/C++ code built with Oracle Solaris Studio on SPARC/Solaris Largest simulations can run for 2-3 days, consume 200+GB RAM, ~32 processes Heavily-optimized codebase, including custom allocators and hand-crafted data structures Time to reproduce and diagnose a bugis a limiting factor for our performance engineers
Two Application Usage Models Referencefor SPARC CPU designs • Projects performance for maturing products • Follows design through pre-silicon implementation • Well-defined designs Gradual changes week-to-week Outcome generally predictable Experimental platform for future CPUs • Initial path-finding looks at “out-of-the-box” ideas • First prototypes often ad-hoc and “use-once”, no specifications, few tests • May eventually inspire reference code Large code revisions week-to-week No two simulations are the same Single code base with biweekly merges of committed code
Targeted Bug Hunting with Discover • On critical path to releasing chip to manufacturing • Hundreds of new lines of code + recent source merge • BUT we hit non-deterministic SEGV in multi-day simulations • I requested a small-input test case from developer • Built a discover-instrumented binary • Ran smaller test case
Targeted Bug Hunting with Discover • On critical path to releasing chip to manufacturing • Hundreds of new lines of code + recent source merge • BUT we hit non-deterministic SEGV in multi-day simulations • I requested a small-input test case from developer • Built a discover-instrumented binary • Ran smaller test case • In <4 hours discover pinpointed both: • Line of code and reasonfor the crash (array bounds write). • Engineer delivered fix the same afternoon buf[-1] = val; [0] ABW! [1] [2] [3] [4]
Biweekly Checkup Process • Previse: static code analysis • Simple rebuild with –xanalyze=code • Error report available immediately after build • Discover: dynamic code analysis • Execute regular battery of check-in tests • 500+ wide-ranging tests; baseline code runs <1 hr in compute ranch • Build rules replace custom memory allocators with trivial malloc()/free() calls using #ifdef, debug compiler flags • We request 2x additional memory, expect longer runtime
Biweekly Checkup Process • Triage output after each weekend run • Perl scripts aggregate previse and discover output • Sort previously-known errors and false positives • Typically a handful of new error signatures • ~30 minutes to dispatch new errors to unit owners • Most commonerrors • Uninitialized variable read/write • Array bounds errors • Freed memory read/write Discover’s output: { Error stack, Alloc location stack, Free location stack } Provides developers sufficient information to completely isolate many common errors Many new errors now detected proactively
Outline Tools introduction SPARC Simulator Case Study OpenSSL Heartbleed Wrap-up 1 2 3 4
OpenSSL Heartbleed Heartbeat sent to victim (4 bytes): Victim’s response (65538 bytes):
OpenSSL Heartbeat source typedefstructssl3_record_st { […] unsigned intlength; /* How many bytes available */ […] unsigned char *data; /* pointer to the record data */ […] } SSL3_RECORD; Read Heartbeat Request unsigned char *p = &s->s3->rrec.data[0], *pl; […] /* Read type and payload length first */ hbtype = *p++; n2s(p, payload); pl = p; Create Heartbeat Response /* Enter response type, length and copy payload */ *bp++ = TLS1_HB_RESPONSE; s2n(payload, bp); memcpy(bp, pl, payload);
OpenSSL Heartbeat source fix typedefstructssl3_record_st { […] unsigned intlength; /* How many bytes available */ […] unsigned char *data; /* pointer to the record data */ […] } SSL3_RECORD; Read Heartbeat Request unsigned char *p = &s->s3->rrec.data[0], *pl; […] /* Read type and payload length first */ hbtype = *p++; n2s(p, payload); pl = p; Create Heartbeat Response /* Enter response type, length and copy payload */ *bp++ = TLS1_HB_RESPONSE; s2n(payload, bp); memcpy(bp, pl, payload); if([…]+payload > s->s3->rrec.length) return0;
Previse Compile Time Analysis • Beyond array bounds access • Freed memory • Memory leaks • Compiler option • No change to the executable int a[5];
Previse Compile Time Analysis • Beyond array bounds access • Freed memory • Memory leaks • Compiler option • No change to the executable int a[5]; for (i=0; i<=5; i++) printf(“%d\n”, a[i]);
Previse Compile Time Analysis int a[5]; • Beyond array bounds access • Freed memory • Memory leaks • Compiler option • No change to the executable for (i=0; i<=5; i++) printf(“%d\n”, a[i]);
Previse Compile Time Analysis int a[5]; • Beyond array bounds access • Freed memory • Memory leaks • Compiler option • No change to the executable for (i=0; i<=5; i++) printf(“%d\n”, a[i]);
Discover Runtime Analysis • Uninitialized memory access • Beyond array bounds access • Across compilation units • Heap, stack, globals • Points to allocation/free code • Memory leak APIs char *z = (char *) malloc(1);
Discover Runtime Analysis • Uninitialized memory access • Beyond array bounds access • Across compilation units • Heap, stack, globals • Points to allocation/free code • Memory leak APIs char *z = (char *) malloc(1); printf(“*y = %c\n”, *y);
Discover Runtime Analysis char *z = (char *) malloc(1); • Uninitialized memory access • Beyond array bounds access • Across compilation units • Heap, stack, globals • Points to allocation/free code • Memory leak APIs printf(“*y = %c\n”, *y);
Discover Runtime Analysis char *z = (char *) malloc(1); • Uninitialized memory access • Beyond array bounds access • Across compilation units • Heap, stack, globals • Points to allocation/free code • Memory leak APIs printf(“*y = %c\n”, *y);
Uncover Code Coverage • Source line level granularity • Weighted call graph based sorting • Coverage potential per function • No recompilation • Accumulates coverage over multiple runs if (unmet_condition) *y = ‘a’;
Uncover Code Coverage • Source line level granularity • Weighted call graph based sorting • Coverage potential per function • No recompilation • Accumulates coverage over multiple runs if (unmet_condition) *y = ‘a’; printf(“*y = %c\n”, *y);
Uncover Code Coverage if (unmet_condition) *y = ‘a’; • Source line level granularity • Weighted call graph based sorting • Coverage potential per function • No recompilation • Accumulates coverage over multiple runs printf(“*y = %c\n”, *y);
Uncover Code Coverage if (unmet_condition) *y = ‘a’; • Source line level granularity • Weighted call graph based sorting • Coverage potential per function • No recompilation • Accumulates coverage over multiple runs printf(“*y = %c\n”, *y);
Dogfooding Internal Studio Usage • Code statistics: • Over 10K C/C++ source/header files • Over 4M lines of C/C++ code • ~300 binaries delivered • Compiler and tools built nightly with Previse, new errors sent to the responsible engineer. • Major components built with Discover, run on a representative test suite.
M7 Application Data Integrity (ADI) Memory checking in Silicon • Real-time Data Integrity checking in test and production environments. • HW implementation, Low overhead • Colored pointers detect accesses outside a memory region. • Buffer overflow • Freed pointer • Stale pointer
ADI in DevelopmentEnsures App Correctness ADI in DeploymentEnsures Data Integrity Application Oracle Solaris Studio Code Analyzer provides detailed diagnostic information to aid developers in fixing memory corruption errors Real-time data protection that provides a more robust, vulnerability-resistant platform
Outline Tools introduction SPARC Simulator Case Study Heartbleed Wrap-up 1 2 3 4
Next Steps and More Information • Oracle Solaris Studio OTN page for download, learning resources, forums • Sessions of interest:
Oracle Solaris Studio 12.4 Highlights Best for Oracle Systems • C++11 support with validation on latest BOOST libraries • Rapid identification of performance bottlenecks with re-designed Performance Analyzer UI • New CLI codean, APIs, and report comparison with updated Code Analyzer • Efficient code editing with IDE tuned for large apps • Highest application performance on new Oracle Systems • Oracle SPARC T5, M5 & M6 • Intel x86 Haswell • Fujitsu M10 & M10+ • Leverage Oracle product integration and joint innovations Best for Enterprise Applications
Questions? Learn More; Stay Connected • oracle.com/goto/solarisstudio • @SolarisStudio • facebook.com/oraclesolarisstudio List of sessions/demos/HOLs: bit.ly/OOW14-Solaris
Hardware and Software Engineered to Work Together Oracle Applications Oracle SPARC & x86 Systems Database Developer Tools A Better Development Platform Tuxedo Oracle Solaris Oracle Linux