Download
1 / 14
140 likes | 259 Views
This presentation by Ed C. Apodaca highlights the critical issue of rising dropout rates among students in higher education and explores collaborative approaches to widen participation in college enrollment. It projects a 60% growth in college enrollment, driven by population and participation improvements. Various factors contributing to dropout rates are analyzed, including school-related, student-related, family-related, and community-related variables. The use of different dropout rate measurements is emphasized, alongside a discussion of the demographics most affected.

E N D
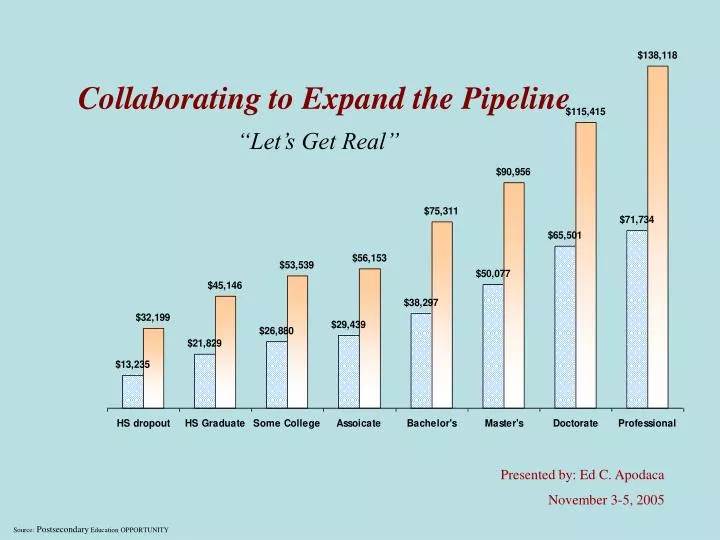
Collaborating to Expand the Pipeline “Let’s Get Real” Presented by: Ed C. Apodaca November 3-5, 2005 Source: Postsecondary Education OPPORTUNITY
“Closing the Gaps”Projected College Enrollment Growth 60% (1,500,000 students) (990,000 students) 30% 44% 41% 14% 9% 2015 2000 Projected Growth= 500,000 more students are expected to enrolled in higher education- 200,000 from population growth, and 300,000 from improved participation.
Ways of measuring dropout rates- Status dropout rates-provide cumulative data among young adults within a specified age range. Event dropout rates-describe the proportion of students who leave school each year without completing a high school degree program. Cohort dropout rates-measure what happens to a cohort of students over a period of time. National Center for Education Statistics (NCES) U. S. Department of Education’s agency responsible for reporting of educational data
National Center for Education Statistics (NCES) (Status Dropout Rates) U.S. youth ages 16 -24
Attrition/Dropout Rates in Texas Intercultural Development Research Association (Cohort Rates) Texas Education Agency (Event Rates)
Texas Education Agency (Event Dropout Rates) Class 2003
School-related factors: Over crowded classrooms Improper/inadequate funding Grade retention Altering school policies Poor curriculum Lack of engaging teachers Lack of discipline School’s size Student-related factors: Poor academic achievement Low motivation/truancy Limited English proficiency Expectations Pregnancy/marriage Drug/Gangs Learning disabilities Peer relationships Who is to Blame for the High Dropout Rates Family-related factors: • Parents’ educational & occupational levels • Mother’s educational background • Student helping to support family • Come from single parent families • Non-English speaking home environment • Ineffective parenting • Lack of interest from parents for education • Mobility Community-related factors • Lack of community support for schools • High incidences of criminal activities • Poor response from court system • Lack of cooperation between schools & community • Low economic level • Teaching vs. Training
What do we know about who drops out and why- Variables Associated with Dropouts • Age... students tend to be older- • Gender... more likely to be male. Females who dropout are often pregnant- • Socioeconomic ... come from low-income families- • Ethnicity... likely to be Black, Hispanic or Native American- • Native Language... come from non-English speaking backgrounds- • Region... live in urban settings- • Ability.. scored low on measures of cognitive ability-
The National Center for Educational Statistic found that the majority of dropouts do not fit the at-risk profile- Although the dropout rates of Blacks are 50% higher than those of Whites and Hispanics’ rates are twice those of Blacks.... Two-thirds of all dropouts are White........ and most dropouts are not from broken homes, not poor, and are not pregnant- High School Dropouts’ Profile Source: National Center on Secondary Education and Transition (NCSET)
Enrollment Trends of Males by Level • From 1957 to 1991 females high school graduates- out numbered males- • From 1991, males high school graduates exceeded females 5 out of the last 7 year- Source: NCES/2003 data
Black Enrollment Trends by Gender and Level Source: NCES/2003 data
Hispanic Enrollment Trends by Gender and Level Source: NCES/2003 data
White Enrollment Trends by Gender and Level Source: NCES/2003 data
U.S. Population in State and Federal Prisons • Texas Prisons- • Cost......$1.8 Billion per year • 73 state facilities- (50% built in past 12 yrs) • 164,702 inmates • 41% high school dropouts • 43% HS diploma/GED • 16% some college