Download
1 / 13
130 likes | 268 Views
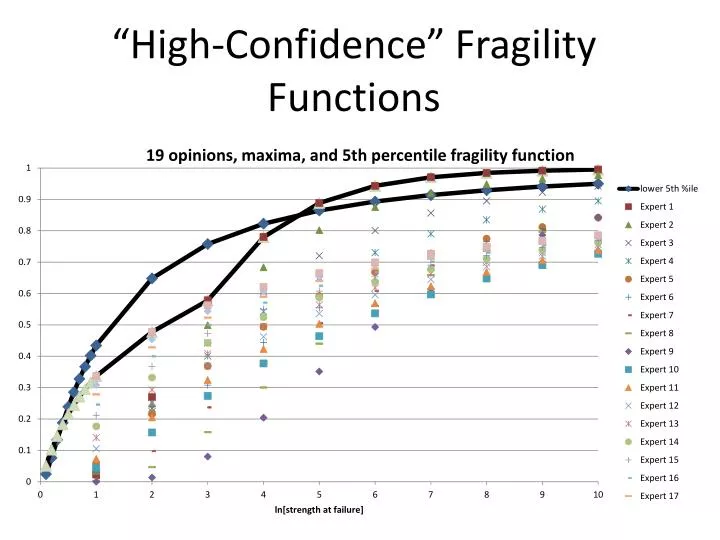
“High-Confidence” Fragility Functions. “High-Confidence” Subjective Fragility Function Estimation. Suppose 19 experts give 19 opinions on fragility median A m and (logarithmic) standard deviation

E N D
“High-Confidence” Subjective Fragility Function Estimation • Suppose 19 experts give 19 opinions on fragility median Am and (logarithmic) standard deviation • For each (discrete) value of strength y, find maximum of 19 cdfs and connectwith a curve Fmax(y) • P[Strength < y|Expert Am and b], (or Am and some percentile) • Assume each maximum represents the upper 95% confidence limit (“High-Confidence”) • Fit a lognormal distribution to curve to represent a 95% “High-Confidence” fragility function using (weighted) least squares • P[F(y) ≤ Fmax(y) for all y] 0.95! Functional confidence curve is not French curve linking 95-th percentiles at several strength values
What if there aren’t 19 experts? • Bootstrap • Correl(X1,X2) estimate requires at least one subjective opinion of distribution of X1|X2 • Use least squares to combine experts’ subjective distribution information • Sum of squared errors indicted magnitude of experts’ deviation from lognormal distribution
Imagine inspections after earthquakes indicate component responses and failure or non-failure NoFail.xlsm Spreadsheets
Freq Spreadsheet • Input iid responses for which no failures occurred • 19 responses were simulated for example and convenient interpretation of mean and standard deviation estimates as “High-Confidence” • Assume ln[Stress]-ln[Strength} ~ N[muX-muY, Sqrt(sigmaX^2+sigmaY^2)] • Use Solver to maximize log likelihood of PP[Non-failure|Response] subject to constraint • Either constrain CV or P[Failure] • Output is ln(Am) and b
Bayes Spreadsheets • Bayes estimate of reliability r = P{ln[Stress]-ln{strength] > 0] • Non-informative prior distribution of r • Same inputs as Freq: responses and non-failures • Use MoMto find ln(Am) and b to match posterior E[r] = n/n+1 and Var[r] = n/((n+1)^2*(n+2)) • Ditto to find correlation r from third moment of a-posteriori distribution of r • Bayes posterior P[ESEL component life > 72 hours|Eq and plant test data]
Parameter Estimates from 19 Non-Failure Responses • Given 19 earthquake responses with ln(Median) = 0.5 and b = 0.1 and reliability P[ln(Stress) < ln(strength)] ~ 95% • Bayes non-informative prior on reliability P[Response < strength] => posterior distribution • Use Method of Moments to estimate parameters for a-posteriori distribution of reliability
What is the correlation of fragilities? • See SubjFrag.xlsx:SubjCorr and NoFail.xlsm:BayesCorr spreadsheets to estimate correlations from subjective opinions on Y1|Y2 or from no-failure response observation • HCLPF ignores fragility correlation • Risk doesn’t ignore it
What if multiple, co-located components? • Could assume responses are same; simplifies computations • In series? Parallel? RBD? Fault tree? • Using event trees, some people argue that HCLPF for one component is representative of all like, co-located components. • If all like, co-located components are all in the same safety system and not in any others
What if like-components are dependent? • Fragilities could be dependent too! • But not necessarily all fail if one fails • True, P[Response > strength] may be same for all like, co-located components • But what is P[g(Stress, strength) = failure] for system structure function g(.,.)?
References • NAP, “Review of Recommendations for Probabilistic Seismic Hazard Analysis: Guidance on Uncertainty and the Use of Experts (1997) / Treatment of Uncertainty,” National Academies Press,http://en.wikipedia.org/wiki/Quantification_of_margins_and_uncertainties