Download
1 / 66
660 likes | 823 Views
Sonoma County Winegrape Commission Survey. August 21, 2007. Acknowledgement and Thanks. The Commission market research team included growers Pamela Gunsalus and Julie Hagler Lumgair. Wine Opinions Panel.

E N D
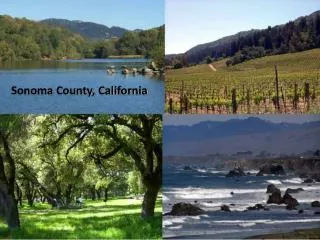
Sonoma County Winegrape Commission Survey August 21, 2007
Acknowledgement and Thanks The Commission market research team included growers Pamela Gunsalus and Julie Hagler Lumgair.
Wine Opinions Panel Panelists are recruited from diverse sources online using various methods, to avoid source bias. Currently 3300 members, about 2300 of whom are active. Based on benchmarking vs. Wine Market Council data, the panel is representative of the “core involved wine drinker,” roughly 18 million consumers who are responsible for about 3/4 of consumer $$ spending on wine. Panel includes smaller samples of less frequent wine drinkers and members of U.S. wine trade (producer, wholesale and retail/restaurant tier). Useful for contrast. Panel members in every state, similar to distribution of core wine drinkers in U.S. Answer 1-2 surveys per month, cash/gift certificate incentives
California Regional Survey Annual Tracking Study
CA Regional Report 620 Wine Opinions consumer respondents. Provide measures of awareness, trial and image for selected California wine regions or appellations. Measurement of visitation to regions by core involved wine consumers. Evaluations of perceived wine quality, price positioning and value. To be executed annually to provide tracking of basic awareness, trial, price, quality and visitation measures. Difference from Regional in-depth studies: no AVAs or sub-regions, no testing of regional-specific image or messages or visitation activities, much less detail.
Regional Awareness and Trial Percent by awareness and trial (in past 3 months) Source: Wine Opinions
Regional Associations with White/Rose Varietals Percent associate by region Source: Wine Opinions
Regional Associations with Red Varietals Percent associate by region Source: Wine Opinions
Pricing Estimates for Typical Wine, by Region Percent stating price range (750ml) Source: Wine Opinions
Survey Objectives Compare awareness and attitudes regarding Sonoma County and its wines to competing world and California wine regions. Identify significant traits associated with Sonoma County and its wines. Assess consumer and trade opinions of Sonoma County attributes, leading grape varieties, and wine quality and value in comparison to other regions. Elicit consumer definitions and expectations of “wine country.” Measure the relative merits of the Sonoma County appellation versus sub-appellations. Measure visitation to Sonoma County and the effects of visitation on quality perceptions.
Survey Methodology Online survey of 686 Wine Opinions panelists 565 high frequency and 121 occasional wine drinkers. 595 consumers and 128 trade members. All states except the District of Columbia, South Dakota, Iowa, and Wyoming Cross tabulations against age, gender, wine consumption frequency, California residents, visitors, high end wine buyers, Sonoma “fans”. Calculated at confidence level of 90%, confidence interval range of ±2% to ±4% for entire sample
Sonoma County Survey Consumer Respondent Profile
Survey Respondent Age Segmentation - Consumers Percentage by age 31 28 20 16 6 21-29 30-39 40-49 50-59 60 Plus Source: Wine Opinions
Survey Respondent Age Segmentation - Consumers Age segments – percentage in each segment by gender 34 33 29 25 21 19 18 10 7 4 21-29 30-39 40-49 50-59 60 Plus Source: Wine Opinions
Survey Respondent Gender Composition - Consumers Percentage by gender 39% 61% Source: Wine Opinions
Consumer Respondent Consumption Frequencies Percentages by segment High Frequency Occasional 52 34 9 4 1 Daily Wkly+ Once Wk 2-3X Mo Once Month Source: Wine Opinions
Consumer Respondent Consumption Frequencies by Gender Consumption frequency percentages by segment and gender 54 50 38 31 12 5 5 2 2 1 Daily Wkly+ Once Wk 2-3X Mo Once Mo Source: Wine Opinions
Consumer Respondent Purchase by Price Point Percentage purchase by frequency and price segment (750ml) 32 44 High End Wine Buyers 35 33 32 30 29 29 29 21 20 19 19 17 15 7 7 6 6 1 1 Weekly Monthly Several x Yr Less Often Never Source: Wine Opinions
Frequency of Purchase by Price Point and Gender Percentage purchasing monthly or more often, by price point and gender 74 73 59 54 50 32 24 12 Under $10 $10 - $20 $20 - $30 Over $30 Source: Wine Opinions
Sonoma County Survey Trade Respondent Profile
WO Trade Panel (as of July 2007) Roughly 300 employees or owners of businesses related to wine. Recruited in same manner as WO consumer panel, plus personal references. 40% restaurant/hospitality, 20% Grape-growing/wineries, 19% retail stores, 13% importer/distributor. Unlike the consumer panel, the data is not projectable to Total U.S. Primarily used for directional and contrast with consumer panel.
Segmentation of Trade Panel Respondents Importers / Distributors Retailers Restaurant Hospitality 32% 48% 20% Growers / Producers Source: Wine Opinions
Trade Respondent Gender Composition Percentage by gender 41% 59% Source: Wine Opinions
Trade Respondent Age Segmentation Percentage by age group 36 22 20 15 7 21-29 30-39 40-49 50-59 60 Plus Source: Wine Opinions
Sonoma County Survey Awareness & Trial
Unaided Consumer Awareness of Wine Regions “Name up to five fine wine regions in the U.S. and/or around the world” Source: Wine Opinions
Unaided Awareness – Sonoma Nomenclature Source: Wine Opinions
Awareness and Trial of Selected Wine Regions Percent by awareness and trial (past year) Source: Wine Opinions
Trial of Selected Wine Regions – Californians vs. Non-Residents Percent by trial Source: Wine Opinions
Sonoma County Survey Quality & Value Assessment
Quality Perceptions of Selected Wine Regions Percent “excellent,” “very good,” and total top two box ratings Source: Wine Opinions
Quality and Value Perceptions of Selected Wine Regions - Consumers Percent total of top two box ratings Source: Wine Opinions
Quality and Value Perceptions of Selected Wine Regions - Trade Percent total of top two box ratings Source: Wine Opinions
Quality & Value Grid Rioja Washington Sonoma Paso Napa Oregon Barossa Tuscany Bordeaux Burgundy
“Excellent” Quality Perceptions – Californians vs. Non-Residents Percent giving “excellent” ratings Source: Wine Opinions
“Excellent” Value Perceptions – Californians vs. Non-Residents Percent giving “excellent” ratings Source: Wine Opinions
Quality and Value Perceptions of Sonoma County Wines – by Visitation Percentage “excellent” ratings by consumer segment 57 44 31 28 24 18 Source: Wine Opinions
Sonoma County Survey Sonoma County: Wine Country
Agreement Statements on Definition of “Wine Country” Percentage completely/somewhat agree Source: Wine Opinions
Qualities or Traits Associated with Sonoma County and its Wines - Consumers Percentage in agreement Source: Wine Opinions
Qualities or Traits Associated with Sonoma County and its Wines - Trade Percentage in agreement Source: Wine Opinions
Quality or Trait Associations: High End Buyers vs. Others Percentage in agreement Source: Wine Opinions
Visitation and Interest by Region or Town Percent stating visitation frequency and/or level of interest Source: Wine Opinions
Sonoma County Survey Sonoma County & its AVAs
Awareness and Trial of Sonoma County AVAs Percent by awareness and trial Source: Wine Opinions
Trial of Sonoma County AVAs – Multiple Visitors vs. Non-Visitors Percent by trial and AVA Source: Wine Opinions
4-celled Test of Label Designation Respondents routed to three similar questions, with the three groups balanced for age, gender and wine-buying frequency. Each question asks respondents to choose between same variety and price of wine, distinguished only by region of origin. Cell 1 = Santa Barbara, Sonoma Cty, Napa Valley Cell 2 = Santa Barbara, Sonoma Cty Russian River Valley, Napa Valley Cell 3 = Santa Barbara, Russian River Valley, Napa Valley. Cell 4 = Santa Barbara, Sonoma County, Paso Robles
Variations on Sonoma AVA – Responses of Four Cells Choice ranking of respondents, by cell Source: Wine Opinions
Ranking of Sonoma AVAs – Cells 1, 2, 3 Source: Wine Opinions