Download
1 / 23
240 likes | 452 Views
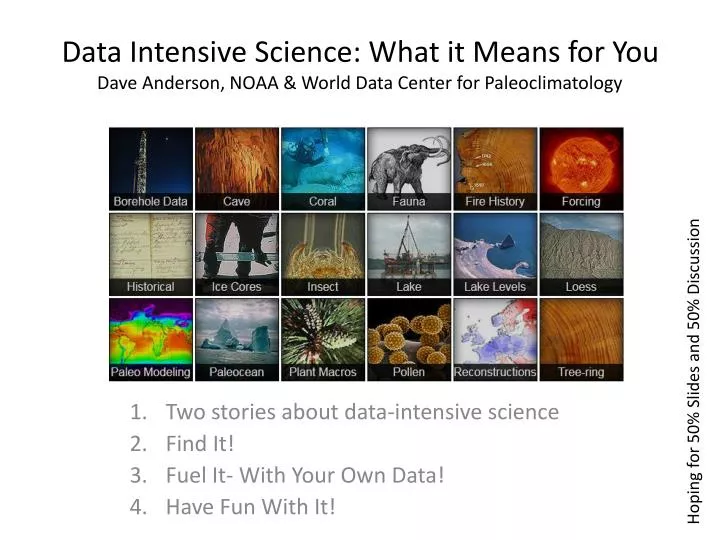
Data Intensive Science: What it Means for You Dave Anderson, NOAA & World Data Center for Paleoclimatology. Hoping for 50% Slides and 50% Discussion. Two stories about data-intensive science Find It! Fuel It- With Your Own Data! Have Fun With It!. Data Intensive Science.

E N D
Data Intensive Science: What it Means for YouDave Anderson, NOAA & World Data Center for Paleoclimatology Hoping for 50% Slides and 50% Discussion Two stories about data-intensive science Find It! Fuel It- With Your Own Data! Have Fun With It!
Data Intensive Science • “Re-using scientific data to solve problems and test hypotheses” • Data Exploration- Everything about science is changing because of the impact of information technology. Experimental, theoretical, and computational science are all being affected by the data deluge, and a fourth, “data-intensive” science paradigm is emerging. The goal is to have a world in which all of the science literature is online, all of the science data is online, and they interoperate with each other. Lots of new tools are needed to make this happen. eScience (Jim Gray) • A new paradigm beyond experimental and theoretical research and computer simulations of natural phenomena—one that requires new tools, techniques, and ways of working.” Douglas Kell, University of Manchester Field Work Laboratory Data Synthesis
Data Intensive Science, cont’d • EarthCube is a massive new initiative in the United States to advance data intensive science • Workshop Feb. 4-6 identified over 160 resources for paleogeosciences • Open source software • Databases, data archives • Sample repositories, museums • This is being built for you- the young Internet Savvy Grad student!! Field Work Laboratory Data Synthesis
Global Oxygen Isotope Stack Produced by Data Synthesis (Lisiecki et al.) • Hypothesis: There is a common signal in the deep ocean d18Ocarbonate records driven by ice volume and deep ocean temperature change during the Quaternary • Ways to Resolve • Get funding, go to sea, spend three years analyzing 24 records (24 x 0.3 samples/ky x 5,000 ky = 40,000 measurements • Theoretical study (Energy Balance Model, Ice Model) • Laboratory study • New! Collect all the published records from Pangaea, NOAA, other repositories, plus your own records, create synthesis
PAGES Regional Reconstructions Produced by Data Synthesis • Hypothesis: The time series of temperature during the last two millennia varies regionally (eg., Arctic twice as sensitive) • Approaches • Get funding, go to sea and collect cores, go to ice and drill, go to lakes and core, go spelunking, return to lab, analyze… • Theoretical (Run climate model with transient forcing) • Laboratory • New! Collaborate with colleagues to collect published records from Pangaea, NOAA, other repositories, create synthesis
Data Synthesis for Four Regions in the PAGES 2K Reconstructions Project Author Team, PAGES Synthesis:
Where to Get Paleo Data • Colleagues! • Archives! • Pangaea • World Data Center for Paleoclimatology • Neotoma • SedDB • Janus, Database for Integrated Ocean Drilling Program • National and International Scientific Initiatives! • International Trans-Antarctic Science Expedition • JGOFS, the Joint Global Ocean Sediment Flux Study
Where to Get Instrumental Data* • Colleagues! • Archives! (many science initiatives have created archives..) • Hadley Center • National Climatic Data Center • Earth System Research Laboratory • Earth System Grid (model data) • IRI/LDEO Climate Data Library (output in a thousand flavors!) • KNMI Climate Explorer • IPCC Data Distribution Centre (its not just climate data) *Focused on sources in the United States!
Climate Data to Know.. Arrgh!@#$% acronyms… • COADS, the Comprehensive Ocean Atmospheres Data Set • Merchant Marine Ship based weather reports • WCMWF, NCEP Reanalysis Products • -gridded meteorological variables since 1950, model-filled • GHCN, the Global Historical Climate Network • GPCP, Global PrecipitationClimatology Centre • monthly, 2.5°x2.5° and 1°x1° Satellite & Gauge Product • HadCRUT, NOAA MLOST Global Gridded Monthly Temp • Surface Ocean Carbon Atlas (SOCAT) *Focused on sources in the United States!
The World of Open Source Software Analyseries Arand BACON C2 CHRONOS Age-Depth Plot (ADP) ChronoZoom conop CoreWall / Corelyzer CoreWall / Correlator CoreWall / PSICAT dplR EdGCM: Educational Global Climate Model Encyclopedia of Life figshare GeoMapApp Gigapan GNRD R-analogue R-rioja Scratchpads Specify Specify stratigraph Tilia Time Scale Creator TRiCYCLE Zone Google Fusion Tables GPlates IAEA-WISER (Water Isotope System for Data Analysis, Visualization and Electronic Retrieval) IsoMap Kepler Kingdom Suite Match Mesquite Ocean Data View Paleomap R-analogue R-rioja Scratchpads Specify Specify
Contribute Your Data, Contribute Your Code • (NOAA) Check the guidelines to make sure your data set is complete, and in a useable format.Contact us if you have questions about what to include or what formats are required. You can also search our existing entries.. • (Pangaea) When you start the data submission process below, you will be redirected to the PANGAEA issue tracker that will assist you in providing metadata and uploading data files. Any communication with our editors will go through this issue tracker. • Future Data Centers will provide web forms or templates • Code: SourceForge is a web-based source code repository. It acts as a centralized location for software developers to control and manage free and open source software development. • You do document your code, right?
Data Sharing- How are we Doing? • Do all countries have similar conventions for sharing? • What about data hoarders? • Can a ‘data publication’ provide the needed credit? • What about data produced by a new PhD graduate? • Should there be a moratorium allowing the graduate to publish their data first? • Should students publish the best, archive the rest? • Any danger of contributing low quality data?
Conclusion- And A Warning • We will only reach the vision if your generation shares their data. Its up to you! • Beware some data collections are not appropriate, not up to the challenge • The best science begins with sample design • Don’t synthesize temperature once a day if you seek the amplitude of the diurnal (24 hour) cycle!
What the Data Look Like* # Diva de Maura Cave, Brazil 2700 Year Stalagmite Oxygen Isotope Data #----------------------------------------------------------------------- # World Data Center for Paleoclimatology, Boulder # and # NOAA Paleoclimatology Program #----------------------------------------------------------------------- # NOTE: Please cite original reference when using these data, # plus the Online Resource and date accessed. # # # Online_Resource: http://hurricane.ncdc.noaa.gov/pls/paleox/f?p=519:1:::::P1_STUDY_ID:13670 # # Original_Source_URL: ftp://ftp.ncdc.noaa.gov/pub/data/paleo/speleothem/southamerica/brazil/diva2012.txt # # Description/Documentation lines begin with # # Data lines have no # # # Archive: Speleothems #-------------------- # Contribution_Date # Date: 2012-12-26 #-------------------- # Title # Study_Name: Diva de Maura Cave, Brazil 2700 Year Stalagmite Oxygen Isotope Data #-------------------- # Investigators # Investigators: Novello, V.F.; Cruz, F.W.; Karmann, I.; Burns, S.J.; Stríkis, N.M.; Vuille, M.; Cheng, H.; Edwards, R.L.; Santos, R.V.; Frigo, E.; Barreto, E.A.S. #-------------------- age_AD d18Ocarb 1911 -2.29 1909 -2.45 1908 -2.74 1906 -2.93 1904 -3.01 1902 -3.09 1901 -2.58 1899 -2.7 1897 -2.89 1896 -3.09 1894 -2.99 1892 -3.09 1890 -3.12 1889 -3.11 1887 -3.14 1885 -3.27 *Most recent contribution to NOAA Paleoclimatology
What the Data Look Like Array Data: More Challenging. ASCII? NetCDF? ASCII Time Series: No problem!
What the Tools Look Like: Analogue • analog(x, ...) • ## Default S3 method: • analog(x, y, • method = c("euclidean", "SQeuclidean", "chord”, "SQchord", "bray", "chi.square", "SQchi.square", "information", "chi.distance", "manhattan", "kendall", "gower", "alt.gower", "mixed"), • keep.train= TRUE, ...) • Arguments • x, y data frames with same columns. X is training, Y the test data • Method character string naming the dissimilarity coefficient to be used. See details below • keep.train logical; should the dissimilarity matrix for the training set be stored? • ... Arguments passed to or from other methods ## Imbrie and Kipp example ## load the example data data(ImbrieKipp) data(SumSST) data(V12.122) ## merge training and test set on columns dat<- join(ImbrieKipp, V12.122, verbose = TRUE) ## extract the merged data sets and convert to proportions ImbrieKipp<- dat[[1]] / 100 V12.122 <- dat[[2]] / 100 ## Imbrie and Kippforaminfera sea-surface temperature ## analog matching between SWAP and RLGH core ik.analog <- analog(ImbrieKipp, V12.122, method = "chord") ik.analog summary(ik.analog)
Jim Gray: The Fourth Paradigm (2007) Science Paradigms • Thousandyearsago: science was empirical describing natural phenomena • Lastfewhundredyears: theoretical branch using models, generalizations • Lastfewdecades: a computational branch simulating complex phenomena • Today:dataexploration(eScience) unify theory, experiment, and simulation – Data captured by instruments or generated by simulator – Processed by software Information/ Knowledge stored in computer -Scientist analyzes database/ files using data management and statistics
Definitions • data mining (sometimes called data or knowledge discovery) is the process of analyzing data from different perspectives and summarizing it into useful information - information that can be used to increase revenue, cuts costs, or both. Data mining software is one of a number of analytical tools for analyzing data. It allows users to analyze data from many different dimensions or angles, categorize it, and summarize the relationships identified. Technically, data mining is the process of finding correlations or patterns among dozens of fields in large relational databases. • For example, one Midwest grocery chain used the data mining capacity of Oracle Software to analyze local buying patterns. They discovered that when men bought diapers on Thursdays and Saturdays, they also tended to buy beer. Further analysis showed that these shoppers typically did their weekly grocery shopping on Saturdays. On Thursdays, however, they only bought a few items. The retailer concluded that they purchased the beer to have it available for the upcoming weekend. The grocery chain could use this newly discovered information in various ways to increase revenue. For example, they could move the beer display closer to the diaper display. And, they could make sure beer and diapers were sold at full price on Thursdays • Data Warehousing Dramatic advances in data capture, processing power, data transmission, and storage capabilities are enabling organizations to integrate their various databases into data warehouses. Data warehousing is defined as a process of centralized data management and retrieval. • Data Intensive Science Data-intensive computing is a class of parallel computing applications which use a data parallel approach to processing large volumes of data typically terabytes or petabytes in size and typically referred to as Big Data. • Geoinformatics has been described as "the science and technology dealing with the structure and character of spatial information, its capture, its classification and qualification, its storage, processing, portrayal and dissemination, including the infrastructure necessary to secure optimal use of this information"[3] or "the art, science or technology dealing with the acquisition, storage, processing production, presentation and dissemination of geoinformation".[4]