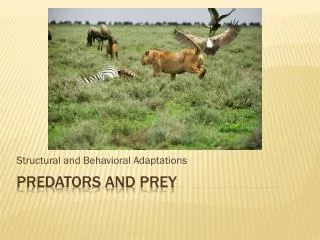
Top Predators
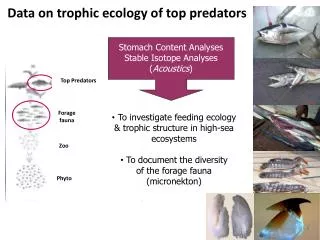
Data on trophic ecology of top predators. Stomach Content Analyses Stable Isotope Analyses ( Acoustics ). Top Predators. Forage fauna. To investigate feeding ecology & trophic structure in high - sea ecosystems To document the diversity of the forage fauna ( micronekton ).

Top Predators
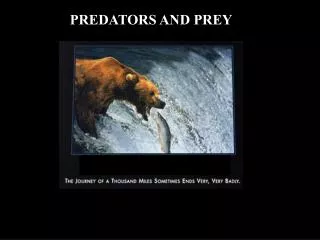
E N D
Presentation Transcript
Data on trophicecology of top predators Stomach Content Analyses Stable Isotope Analyses (Acoustics) Top Predators Forage fauna • To investigatefeedingecology • &trophic structure in high-sea • ecosystems • To document the diversity • of the forage fauna • (micronekton) Zoo Phyto
Stomach content data Stomachs are taken from freshly caught fishes Dietindices on prey Occurrence MeanNumber MeanReconstitutedWeight stomachs are frozen Diet Feeding range Trophic overlap Prey size distributions Size ratios and analysed in the lab
INDIAN OCEAN: 2 databases • YugNIRO 1962 to 1990 (Soviet Union) • Low level of prey identification – Heterogeneity of data • STOMAC 2000 to 2010 (IRD) • Small spatial and temporal scales – High identification prey level > 20,000 stomachs 6 main predators 300 prey taxa 5 functional groups YugNIRO (Indian Ocean) STOMAC (West Indian Ocean)
6 main predators Yellowfintuna (Thunnus albacares) Bigeyetuna (Thunnus obesus) Skipjack (Katsuwonuspelamis) Swordfish (Xiphias gladius) Dolphinfish (Coryphaenahippurus) Longnoselancetfish (Alepisaurus ferox)
Functionalpreygroups vs >300 prey taxa Epi-Pel Epi-Meso depth Meso Meso-Bathy Bathy
Stable Isotope Analyses (d15N, d13C) a tool to investigatetrophicrelationships (trophictracers) +ΔN +ΔN +ΔN +ΔN 15N baseline 15N predator ″ You are whatyoueat, plus a few per mil " 15N = n‰ 15N = n +4ΔN‰ ΔN = Trophic enrichment Stable isotope ratios of N in consumers reflect those of their prey as they are enriched in a predictable manner d15N serve as indicators of consumer trophic position
PRINCIPE : les processus biologiques, physiques et chimiques induisent une répartition différentielle des éléments légers et lourds • Cause : essentiellement dus aux différences de masse • variation de certaines propriétés physico-chimiques • modification des vitesses des réactions chimiques • réactivité différentielle • changement du rapport entre éléments lourds et légers
14NH4+ 14NH4+ 14NH4+ 14NH4+ 14NH4+ Nitrogen Isotope Fractionation δ15Npredator = ~3.0 + δ15Nprey (‰) NO3-, NH4+ N2 Rate of 14NH4+ excretion is greater than the rate of 15NH4+ excretion
Stable Isotope Analyses (d15N, d13C): a tool to investigatetrophicrelationships • Multispecies trophic models of ecosystems depend on accurate depiction of trophiclinks • Trophic level estimation using d15N Latitudinal effect on d15N : differencesin nitrogen dynamics existing at the base of the food web propagate along the food chain up to top predators • Isoscapes…
d15N isoscapes for bigeye (n = 196) and yellowfin (n = 387) tuna Values were normalized against the average within the study region (Graham et al.) bigeye yellowfin Residuals between the interpolated d15Nvalues for the two species