Download
1 / 7
70 likes | 234 Views
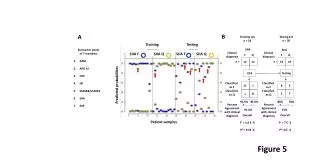
B. A. Training set n = 24. Testing set n = 20. Training. Testing. SJIA. Biomarker panel of 7 members A2M APO AI CRP HP S100A8/S100A9 SAA SAP. SJIA. Clinical diagnosis. Clinical diagnosis. SJIA F. SJIA Q. SJIA F. SJIA Q. F. Q. F. Q. 12. 12. 10. 10. n =. n =.

E N D
B A Training set n = 24 Testing set n = 20 Training Testing SJIA • Biomarker panel • of 7 members • A2M • APO AI • CRP • HP • S100A8/S100A9 • SAA • SAP SJIA Clinical diagnosis Clinical diagnosis SJIA F SJIA Q SJIA F SJIA Q F Q F Q 12 12 10 10 n = n = LDA Testing Classified as F Classified as F 11 1 8 3 Predicted probabilities Classified as Q Classified as Q 1 11 2 7 91.6% 91.6% 80% 70% Percent Agreement with clinical diagnosis + - Percent Agreement with clinical diagnosis + - 91.6% 75% Overall P = 1.0 E -4 Overall P = 7 E -2 Patient samples P*= 9.6E -6 P*=4 E -3 Figure 5
C Training Set Testing Set Training + Testing Set Sensitivity Sensitivity Sensitivity ESR : AUC=0.86 ESR : AUC=0.96 ESR : AUC=0.92 S100A8/S100A9 : AUC=0.78 S100A8/S100A9 : AUC=0.73 S100A8/S100A9 : AUC=0.74 CRP : AUC=0.65 CRP : AUC=0.82 CRP : AUC=0.72 panel : AUC=0.82 panel : AUC=0.95 panel : AUC=0.94 1- Specificity 1- Specificity 1- Specificity Figure 5
C B A Training set n = 23 Testing set n = 15 Training Testing POLY F vs. Q POLY POLY Clinical diagnosis Clinical diagnosis PF PQ PF PQ F Q F Q 13 10 10 5 n = n = Sensitivity LDA Testing Classified as F Classified as F 10 5 3 0 Predicted probabilities Classified as Q Classified as Q 3 5 7 5 76.9% 50% 30% 100% Percent Agreement with clinical diagnosis + - Percent Agreement with clinical diagnosis + - panel : AUC=0.64 65.2% 53.3% CRP : AUC=0.64 Overall P = 0.41 Overall P = 0.20 Patient samples 1- Specificity Supplementary Figure 3
A. B SJIA F FI SJIA F Clinical diagnosis FI Sensitivity 22 27 n = ESR : AUC=0.635 LDA Predicted probabilities S100A8/S100A9 : AUC=0.551 Classified as SJIA F 16 2 6 25 Classified as NOT SJIA F CRP : AUC=0.571 72.8% 92.6% panel : AUC=0.838 Percent Agreement with clinical diagnosis + - 83.7% Overall P = 2.7 E -6 1- Specificity Patient samples Figure 6
B A QF QQ SJIA Clinical diagnosis QF QQ 5 10 Sensitivity n = LDA Predicted probabilities Classified as QF 4 0 Classified as QQ 1 10 ESR : AUC=0.68 80% 100% S100A8/S100A9 : AUC=0.74 Percent Agreement with clinical diagnosis + - CRP : AUC=0.82 93.3% panel : AUC=0.90 Overall P = 3.7 E -3 Patient samples 1- Specificity Figure 7
SJIA F KD A B ATIII A2M HP APOIV GSN APO A1 SAA SAP AGP1 P value: 2.9 E -4 Figure 9