
Visual Vertical Perception and Error Analysis in Parkinson's Disease During CRAF Testing
This study investigates the distribution of unsigned errors in aligning a rod with a tilted frame during the Computerized Rod and Frame (CRAF) test, comparing patients with Parkinson's disease (PD) to control subjects. Participants exhibiting significant deviation from the gravitational vertical were excluded from the analysis. The results highlight critical differences in visual perception of verticality between PD patients and healthy controls, contributing to our understanding of sensorimotor processing in Parkinson's disease.

Visual Vertical Perception and Error Analysis in Parkinson's Disease During CRAF Testing
E N D
Presentation Transcript
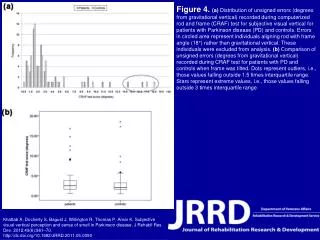
Figure 4. (a) Distribution of unsigned errors (degrees from gravitational vertical) recorded during computerized rod and frame (CRAF) test for subjective visual vertical for patients with Parkinson disease (PD) and controls. Errors in circled area represent individuals aligning rod with frame angle (18°) rather than gravitational vertical. These individuals were excluded from analysis. (b) Comparison of unsigned errors (degrees from gravitational vertical) recorded during CRAF test for patients with PD and controls when frame was tilted. Dots represent outliers, i.e., those values falling outside 1.5 times interquartile range. Stars represent extreme values, i.e., those values falling outside 3 times interquartile range. Khattab A, Docherty S, Bagust J, Willington R, Thomas P, Amar K. Subjective visual vertical perception and sense of smell in Parkinson disease. J Rehabil Res Dev. 2012;49(6):961–70.http://dx.doi.org/10.1682/JRRD.2011.05.0090