Download

1 / 30
300 likes | 386 Views
Explore the wave energy opportunities off the Oregon coast with OSU's innovative multidisciplinary team. Learn about cutting-edge wave energy technologies, research on energy conversion, and the enormous potential for sustainable power generation. Discover how wave energy can contribute to Oregon's renewable energy goals and the global shift towards clean energy sources.

E N D
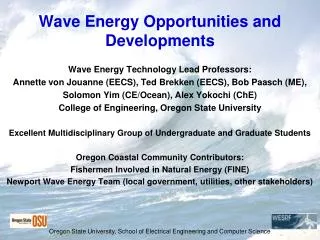
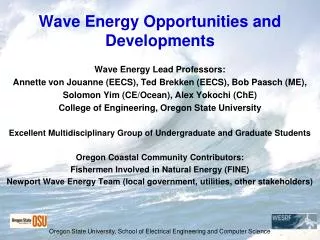
Wave Energy Opportunities and Developments Wave Energy Lead Professors: Annette von Jouanne (EECS), Ted Brekken (EECS), Bob Paasch (ME), Solomon Yim (CE/Ocean), Alex Yokochi (ChE) College of Engineering, Oregon State University Excellent Multidisciplinary Group of Undergraduate and Graduate Students Oregon Coastal Community Contributors: Fishermen Involved in Natural Energy (FINE) Newport Wave Energy Team (local government, utilities, other stakeholders)
OSU’s multidisciplinary Wave Energy team is pursuing innovation in several thrust areas including:1) Researching novel direct-drive wave energy generators -11th prototype (10kW) successfully ocean tested with CPT Sept. 2008- Hydrodynamic behavior fit our expectations and design, the deployment went smoothly and we collected a large amount of data to further evaluate - The CPT and OSU team did a tremendous job in this collaborative effort 2) Developed Unique Wave Energy Linear Test Bed 3) National Marine Renewable Energy Center in the PNW-ocean test berths, environmental studies, community outreach etc.-Power analysis and data acquisition system development
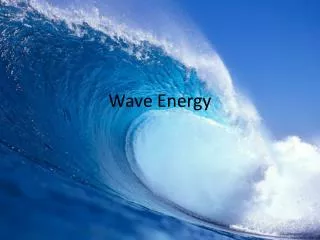
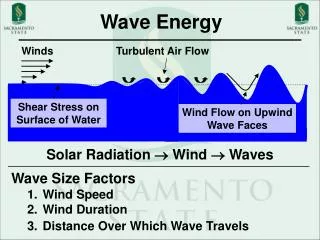
Waves Waves are a concentrated form of solar energy Technology to convert wave energy to electrical energy is in its beginning phase > 1000 Patents < 2 MW Installed Demonstration in the U.S. is the Next Needed Step in the Technology Development Process
New forms of Energy are required ! Introduction to Wave Energy • It is estimated that if 0.2% of the ocean’s untapped energy could be harnessed, it could provide power sufficient for the entire world. Compared to Other Renewables, Wave Energy Advantages: Higher energy density, availability (80 – 90%) and predictability • OSU is an Excellent Location to conduct ocean wave energy extraction research: • Highest Power University-Based Energy Systems Lab • O.H. Hinsdale Wave Research Lab • Hatfield Marine Science Center • Wave energy potentials off the Oregon coast.
Oscillating Water Column (Energetech/Oceanlinx) Wave Energy Extraction Technologies Point Absorber (OPT, Finavera) Overtopping, Wave Dragon Attenuator, Pelamis WP
OSU Strategic Facilities to Advance Wave Energy O.H. Hinsdale Wave Research Lab (HWRL) Wallace Energy Systems & Renewables Facility (WESRF)
OSU Wave Energy Linear Test Bed Creates the relative linear motion between a center “spar” and a surrounding “float” (active components) Enables dynamic testing, using captured wave profiles, while simulating the actual response of ocean waves • Specifications: • 10kW with a 50% efficient device, and up to 19kW @ 95% efficiency • 1m/sec @ 20,000 N Thrust (4500 lbf) • 2m/sec @ 10,000 N Thrust (2250 lbf) • Modes: Velocity, Point-Point, & Force Control (through feedback from load cells/force meters) • 2m relative motion/stroke (6.5 feet) • Upper & Lower Gimbal mounting (for alignment variation) • 14ft tall x 10.5ft wide x 8.5ft deep Design: Mundt and Associates Inc.
Power from Ocean WavesAvailable Resource off Oregon Coast NDBC Data Buoys CDIP (SCRIPPS) Data Buoys • 50% of the US population lives within 50 miles of the coast • Oregon has some of the richest ocean wave energy potentials in the world
Power from Ocean WavesAvailable Resource off Oregon Coast Data buoys are 2-200mi off shore, with waves traveling 15-20mph, gives 10+ hours forecast time for buoy generators located 2 mi out Seasonal variation – Good match for the NW load demand (wave data From National Data Buoy Center, Power estimated from 5 buoys off the Oregon coast over past 10 years) Power from a wave is W/m of crest length (distance along an individual crest) = the density of sea water = 1025 kg/m3 g = acceleration due to gravity = 9.8 m/s2 T = period of wave (s) (averages 8s in the winter to 6s in the summer) H = wave height (m) (averages 3.5m in the winter to 1.5m in the summer)
Power From Ocean Waves kW/m crest length
Wave energy is strongest on the west coasts and increases toward the poles. • At approx. 30 kW/mcl in the Northwest (yearly avg.), a single meter (3.3 feet) of wave has the raw energy to power about 23 homes. Power From Ocean Waves [George Hagerman]
Potential Wave Energy Impact on Oregon (Load Data Provided by PGE) Oregon 2005 Avg Consumption Generation West of Cascades: 3,488MW (68%) 2,487MW (29%) (1001MW deficit) East of Cascades: 1,633MW (32%) 6,163MW (71%) Total: 5,121MW 8,650MW From the previous slide (Winter avg is 50kW/m, Summer avg is 10kW/m), Considering an overall average of 30kW/m and an Oregon coastline of 460km, the total Oregon coast “raw” Wave Energy potential is in the range of 13,800MW In Perspective Seven sites have been identified by EPRI study, with the potential to expand to 100MW (estimated that three sites could be fully licensed in next 7-10 years) Oregon goal for 25% renewables by 2025 (this goal could be 50% satisfied by 700MW from wave energy, based on current consumption)
EPRI Study: Seven Oregon Sites • Astoria • Garibaldi INSERT OREGON MAP ‘Wave Park’ Sites Identified by EPRI Study • Newport • Cushman • Reedsport • Coos Bay • Brookings
Wave Energy FERC Preliminary Permit Filings as of March 2008
OSU Test Berth Site agreed upon with FINE 0 3000’ 6000’
The Pacific Storm was able to hold station in order to allow the power take-off cable to go directly to the power analysis and data acquisition system on the vessel
National Marine Renewable Energy Center • Demonstrate and compare existing technologies • Research and develop advanced systems • Investigate efficient and reliable utility integration/intermittency issues • Advance wave forecasting technologies • Conduct experimental and numerical modeling for device and wave park array optimization • Evaluate potential environmental and ecosystem impacts • Establish protocols for outreach/engagement and how the ocean community best interacts with wave energy devices and parks • Refine wave energy power measurement standards • Improve wave energy device identification/navigation standards • Offer wave energy educational workshops • Enable enhanced testing of instruments, etc.
Oregon’s Leadership Opportunity • Unique ocean resource • Established marine community • Excellent reputation for renewable energy and green industry support • Positive political climate (both state & federal) “Oregon is poised to lead the nation and the world in wave energy research, development and production. We have the wave resource, the expertise through collaboration including tremendous university, industry, utility and community support, and the utility infrastructure along the coast to deliver this clean, renewable power into the grid.” For More info on Wave Energy: DVD from Oregon Sea Grant