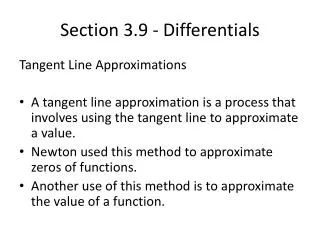
Section 3.9 - Differentials
Section 3.9 - Differentials. Local Linearity. If a function is differentiable at a point, it is at least locally linear. Differentiable. Local Linearity. If a function is differentiable at a point, it is at least locally linear. Not differentiable. The function is NOT smooth at this point.

Section 3.9 - Differentials
E N D
Presentation Transcript
Local Linearity If a function is differentiable at a point, it is at least locally linear. Differentiable
Local Linearity If a function is differentiable at a point, it is at least locally linear. Not differentiable. The function is NOT smooth at this point.
Local Linearity If a function is differentiable at a point, it is at least locally linear. The function is differentiable at every point. The function is always smooth.
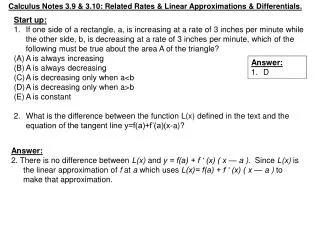
How to Approximate a Function A line that best approximates the graph of a function is the tangent line (if the values are near the point of tangency).
How to Approximate a Function Point of Tangency ( c , f (c) ) Tangent Line y – f (c) = f '(c) (x – c) A point (x,y) on the tangent line approximates the value of the function (must be near the point of tangency) y = f (c) + f '(c) (x – c)
Linear Approximation The linear approximation or tangent line approximation of a function f at x = c: This is also referred to as the linearization of f at x = c. Our Book uses T(x) instead of L(x)
Example 1 Find the local linear approximation of at x0 = 1. Use the linearization formula if c = x0= 1.
Example 2 Use the linearization of at π/6 to approximate sin 0.5. Use the linearization formula if c = π/6. Evaluate the linearization formula at x = 0.5.
Error in Local Linear Approximations As a general rule, the accuracy of the linearization to f (x) at c deteriorates as x gets further away from c. The size of the error of the approximation is simply the vertical gap between the graph and the tangent line: Over Estimate Under Estimate Error
Example 2 (Continued) Use the linearization of at π/6 to approximate sin 0.5. Since Our approximation is an over estimate and the error is: The further away from π/6 the worse the approximation: 0.003542 0.39296 0.389418 0.4 .01000 0.045211 0.01 0.05521
Example 3 Use linearization to approximate . Is the approximation an overestimate or underestimate. Let the function be: Since the square root of 4 is well known, let c = 4. Evaluate the linearization formula at x = 0.5. Our approximation is an over estimate Since
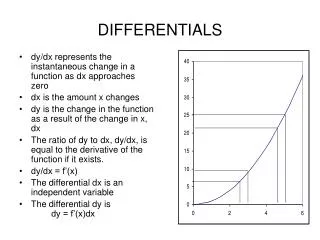
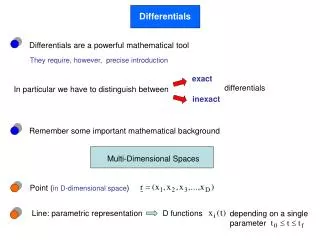
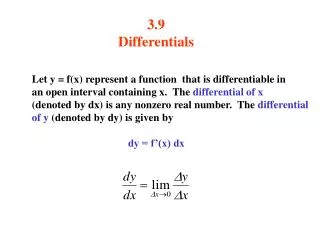
Introduction to Differentials So far we associated the following items to be equivalent: Now we will consider the differentials “dy” and “dx” to represent two different real numbers. Thus dy/dx becomes a real number ratio. Also, if f is differentiable at x, then becomes
Introduction to Differentials Slope of tangent line: Thus the horizontal differences are always equal: Solve for the differential dy: Error Error is not the only “differen”ce we can calculate Find the change in y: Thus the two vertical differences are almost equal:
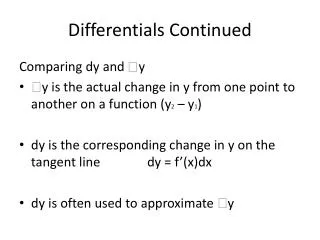
Differentials If y = f (x), where f is a differentiable function, then the differential of x,dx, is an independent variable; that is, dx can be given the value of any real number. The differential of y, dy, is then defined in terms of dx by the equation: So dy is the is a dependent variable; it depends on the values of x anddx. Remember:
Example 1 Compare the values of Δyand dy if f (x) =x3 + x2 – 2x + 1 and dx = 0.05. Thus, Δy and dy are approximately equal (withΔy being slightly larger)
Example 2 Find the differential of Use the differential formula for dy.
Example 3 Find the differential dyof Since this is an implicit equation, you can either solve for y or use a method similar to the differentiation process in related rates/implicit differentiation. The following shows the latter: Now solve for dy:
Example 4 The radius r of a circle increases from 10 m to 10.1 m. Use differentials to estimate the increase in the circles area A. The function for area is: Evaluate the differential formula at r = 10 Use the differential formula to find dA: The increase in the circles areas is about 2π m2
Three Ways to Describe Change As we move from c to a nearby point c + dx, we can describe the change in f in three ways: Measurement Error: Propagated Error: dx = Δx dy Other Vocab
Example 1 Inflating a bicycle tire changes its radius from 12 inches to 13 inches. Use differentials to estimate the actual change, the relative change, and the percentage change in the perimeter of the tire. Estimate the changes (Errors): Calculate necessary information for the formulas: Actual Relative Percentage Actual: Relative: Percentage:
Example 2 Suppose that the side of a square is measured with a ruler to be 10 inches with a measurement error of at most ± 1/32 in. Estimate the error in the computed area of the square. The function for area is: Evaluate the differential formula at s = 10 Use the differential formula to find dA: Thus, the propagated error in the area is estimated to be within ± 5/8 in2
Example 3 The volume of a sphere is to be computed from a measured value of its radius. Estimate the maximum permissible percentage error in the measurement if the percentage error in the volume must be kept within ± 1.2%. The function for volume is: Use the Differential Formula to find dV: Use the known information to Find % Error of the Radius: Thus, the estimated percentage error in the volume is within ± 0.4% Definition of percentage error