Download

1 / 39
390 likes | 499 Views
Learn the characteristics of good survey questions: unbiased, clear, and precise. Explore examples and different methods of data collection for accurate and meaningful results.

E N D
Data Collection and Presentation Still John F. Reyes PART 1
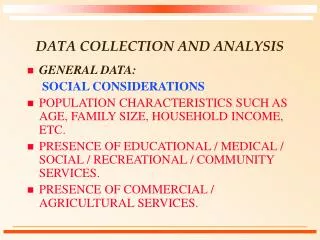
Methods of Data Collection Characteristics of a Good Question • A good question is unbiased. • Questions must not be worded in a manner that will influence the respondent to answer in a certain way, that is to favor a certain response or to be against it. • An unbiased question is stated in neutral language and no element of pressure.
Methods of Data Collection Characteristics of a Good Question Examples of unbiased questions: • Do you favor the enrolment procedure employed last semester? • Do you like classical music? Examples of biased questions: • Do you favor the enrolment procedure employed last semester which makes long lines shorter? • Do you listen to boring classical music?
Methods of Data Collection Characteristics of a Good Question • A good question must be clear and simply stated. • A question that is simple and clear will be easier to understand and more likely to be answered truthfully. Example of a simple and clear question: • What is your average grade last semester? Example of a not simple question: • What is your academic performance last semester?
Methods of Data Collection Characteristics of a Good Question • Questions must be precise. • Questions must not be vague. The question should indicate clearly the manner how the answers must be given. Example of a precise question: • In terms of mathematical ability, do you think male and female are equal? Example of a vague question? • Do you think male and female are equal?
Methods of Data Collection Characteristics of a Good Question • Good questionnaires lend themselves to easy analyses. Two Categories of Survey Questions • Open question – An open question allows a free response. Ex: What do you think can be done to reduce crime? • Closed question – a closed question allows only a fixed response.
Methods of Data Collection Example of a Closed Question: • Which of the following approaches would be most effective in reducing crime? Choose one. • Get parents to discipline children more. • Correct social and economic conditions in slums. • Improve rehabilitation efforts in jails. • Give convicted criminals tougher sentences. • Reform courts.
Methods of Data Collection Types of Data • Primary Data are information collected from an original source of data, which is first-hand in nature. Examples are data collected from interviews and surveys. • Secondary Data are information collected from published or unpublished sources like books, newspapers, and thesis.
Methods of Data Collection Four Important Points to Consider When Collecting Data • If measurements of some characteristic from people (such as height) are being obtained, better results will be achieved if the researcher does the measuring instead of asking the respondent for the value. • The method of data collection used may expedite or delay the process. Avoid a medium that would produce low response rates.
Methods of Data Collection Four Important Points to Consider When Collecting Data • Ensure that the sample size is large enough for the required purposes. • Ensure that the method used to collect data actually results in a sample that is representative of the population.
Methods of Data Collection The ff. are the Methods of Data Collection Primary data can be obtained through: • Direct or Interview Method • Indirect or Questionnaire Method • Registration Method • Observation • Experimentation
Methods of Data Collection • Direct or Interview Method – The direct or interview method of data collection use at least two persons (an interviewer and interviewee/s) exchanging information. This method will give us precise and consistent information because clarifications can be made. Also, questions not fully understood by the respondent, the interviewer could repeat the question until it suits the interviewee’s level. However, this method is time consuming, expensive and has limited field coverage.
Methods of Data Collection • Indirect or Questionnaire Method – This is a method where written answers are given to prepared questions. This method requires less time and is inexpensive since the questionnaires can simply be mailed or hand-carried. Also, this will give a respondent a sense of freedom in honestly answering the questions because of anonymity. • Registration Method – This is a method enforced by certain laws.
Methods of Data Collection • Observation Method – This is a method, which observes the behavior of individuals or organizations in the study. This is also used when the respondents cannot read nor write. • Experiment Method – This method is used when the objective of the study is to determine the cause and effect of certain phenomena or event.
Sampling Samplingis concerned with the selection of a subset of individuals from within a statistical population to estimate characteristics of the whole population.
Sampling Some Definitions: • Target Population – The target population is the entire group a researcher is interested in. • Sampled Population – The sampled population is the collection of elements from which the sample is actually taken. • Population Frame – is a listing of all the individual units in the population. • Sampling Frame – the list of sampling units.
Probability and Nonprobability Sampling Probability Sampling • A probability sampling is one in which every unit in the population has a chance (greater than zero) of being selected in the sample, and this probability can be accurately determined. The combination of these traits makes it possible to produce unbiased estimates of population totals, by weighting sampled units according to their probability of selection.
Probability and Nonprobability Sampling Probability sampling includes: Simple Random Sampling, Systematic Sampling, Stratified Sampling, and Cluster or Multistage Sampling. These various ways of probability sampling have two things in common: 1. Every element has a known nonzero probability of being sampled and 2. Involves random selection at some point.
Probability and Nonprobability Sampling Simple Random Sampling • In a simple random sample (SRS) of a given size, all such subsets of the frame are given an equal probability. Furthermore, any given pair of elements has the same chance of selection as any other such pair (and similarly for triples, and so on). This minimizes bias and simplifies analysis of results. In particular, the variance between individual results within the sample is a good indicator of variance in the overall population, which makes it relatively easy to estimate the accuracy of results.
Probability and Nonprobability Sampling Simple Random Sampling • However, SRS can be vulnerable to sampling error because the randomness of the selection may result in a sample that doesn't reflect the makeup of the population. For instance, a simple random sample of ten people from a given country will on average produce five men and five women, but any given trial is likely to overrepresent one sex and underrepresent the other. (Systematic and stratified techniques), attempt to overcome this problem by "using information about the population" to choose a more "representative" sample.
Probability and Nonprobability Sampling Systematic Sampling • Systematic sampling relies on arranging the study population according to some ordering scheme and then selecting elements at regular intervals through that ordered list. Systematic sampling involves a random start and then proceeds with the selection of every kth element from then onwards. In this case, k=(population size/sample size). It is important that the starting point is not automatically the first in the list, but is instead randomly chosen from within the first to the kth element in the list. A simple example would be to select every 10th name from the telephone directory
Probability and Nonprobability Sampling Systematic Sampling Example: Suppose a supermarket wants to study buying habits of their customers, then using systematic sampling they can choose every 10th or 15th customer entering the supermarket and conduct the study on this sample.
Probability and Nonprobability Sampling Stratified Sampling • In statistical surveys, when subpopulations within an overall population vary, it is advantageous to sample each subpopulation (stratum) independently. Stratification is the process of dividing members of the population into homogeneous subgroups before sampling. The strata should be mutually exclusive: every element in the population must be assigned to only one stratum. The strata should also be collectively exhaustive: no population element can be excluded.
Probability and Nonprobability Sampling Stratified Sampling Ex: In general the size of the sample in each stratum is taken in proportion to the size of the stratum. This is called proportional allocation. Suppose that in a company there are the following staff: • male, full-time: 90 • male, part-time: 18 • female, full-time: 9 • female, part-time: 63 • Total: 180
Probability and Nonprobability Sampling Stratified Sampling and we are asked to take a sample of 40 staff, stratified according to the above categories. The first step is to find the total number of staff (180) and calculate the percentage in each group. % male, full-time = 90 / 180 = 50% % male, part-time = 18 / 180 = 10% % female, full-time = 9 / 180 = 5% % female, part-time = 63 / 180 = 35%
Probability and Nonprobability Sampling Stratified Sampling This tells us that of our sample of 40, 50% should be male, full-time. 10% should be male, part-time. 5% should be female, full-time. 35% should be female, part-time. 50% of 40 is 20. 10% of 40 is 4. 5% of 40 is 2. 35% of 40 is 14.
Probability and Nonprobability Sampling Cluster Sampling • Cluster sampling is a sampling technique used when "natural" but relatively homogeneous groupings are evident in a statistical population. It is often used in marketing research. In this technique, the total population is divided into these groups (or clusters) and a simple random sample of the groups is selected. Then the required information is collected from a simple random sample of the elements within each selected group. This may be done for every element in these groups or a subsample of elements may be selected within each of these groups.
Probability and Nonprobability Sampling Cluster Sampling • A common motivation for cluster sampling is to reduce the total number of interviews and costs given the desired accuracy. Assuming a fixed sample size, the technique gives more accurate results when most of the variation in the population is within the groups, not between them.
Probability and Nonprobability Sampling Cluster Sampling • One version of cluster sampling is area sampling or geographical cluster sampling. Clusters consist of geographical areas. Because a geographically dispersed population can be expensive to survey, greater economy than simple random sampling can be achieved by treating several respondents within a local area as a cluster.
Probability and Nonprobability Sampling Non-Probability Sampling • Nonprobability sampling is any sampling method where some elements of the population have no chance of selection (these are sometimes referred to as 'out of coverage'/'undercovered'), or where the probability of selection can't be accurately determined. It involves the selection of elements based on assumptions regarding the population of interest, which forms the criteria for selection.
Probability and Nonprobability Sampling Non-Probability Sampling • Example: We visit every household in a given street, and interview the first person to answer the door. In any household with more than one occupant, this is a nonprobability sample, because some people are more likely to answer the door (e.g. an unemployed person who spends most of their time at home is more likely to answer than an employed housemate who might be at work when the interviewer calls) and it's not practical to calculate these probabilities.
Probability and Nonprobability Sampling Some Types of Nonprobability Sampling: 1.Quota Sampling 2. Accidental Sampling Quota Sampling • In quota sampling, the population is first segmented into mutually exclusive sub-groups, just as in stratified sampling. Then judgement is used to select the subjects or units from each segment based on a specified proportion. For example, an interviewer may be told to sample 200 females and 300 males between the age of 45 and 60.
Probability and Nonprobability Sampling Quota Sampling • It is this second step which makes the technique one of non-probability sampling. In quota sampling the selection of the sample is non-random. For example interviewers might be tempted to interview those who look most helpful. The problem is that these samples may be biased because not everyone gets a chance of selection. This random element is its greatest weakness and quota versus probability has been a matter of controversy for several years.
Probability and Nonprobability Sampling Accidental Sampling • Accidental sampling (sometimes known as grab, convenience or opportunity sampling) is a type of nonprobability sampling which involves the sample being drawn from that part of the population which is close to hand. That is, a population is selected because it is readily available and convenient. It may be through meeting the person or including a person in the sample when one meets them or chosen by finding them through technological means such as the internet or through phone.
Probability and Nonprobability Sampling Accidental Sampling • The researcher using such a sample cannot scientifically make generalizations about the total population from this sample because it would not be representative enough. For example, if the interviewer were to conduct such a survey at a shopping center early in the morning on a given day, the people that he/she could interview would be limited to those given there at that given time, which would not represent the views of other members of society in such an area, if the survey were to be conducted at different times of day and several times per week.
Other Types of Sampling Purposeful/Purposive Sampling • The sample is selected based on the characteristics of the units relevant to the research problem. The logic of purposeful sampling is that a few information-rich cases studied in-depth could yield many insights about a topic.
For example, we suspect that not being accepted in a prestigious university is a risk factor for certain stress disorders, but the population includes very few unaccepted individuals. For the purpose of the study, the researcher may make an arrangement with the Admission Office of a certain prestigious university to enable him to get in touch with these people. In this case, the respondents are gathered for a certain purpose and the sampling technique is known as purposeful sampling.
Comprehensive Sampling • It is used when every unit of the population is included in the study. This is applicable when number of units is small.
For example, a science educator is interested to know the outstanding character or personality traits of those who have been chosen as outstanding science teachers in the Philippines. As a researcher, you would like to know what makes these science teachers outstanding. Since the sample size is very limited, all outstanding science teachers chosen in the past years will be included in the study.