Download
1 / 56
580 likes | 832 Views
Global and Local Impact of Air Pollution on Health. Junfeng (Jim) Zhang Professor of Global and Environmental Health. Global Health Challenges Duke University, October 17, 2013 . Air Pollution throughout History. The earliest form of anthropogenic airborne emission is wood smoke.

E N D
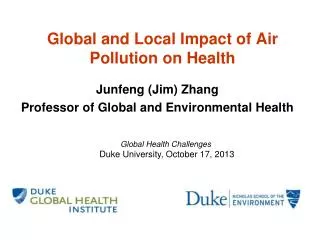
Global and Local Impact of Air Pollution on Health Junfeng (Jim) Zhang Professor of Global and Environmental Health Global Health Challenges Duke University, October 17, 2013
Air Pollution throughout History • The earliest form of anthropogenic airborne emission is wood smoke. • Humans have required sources of warmth and cooking fuel for millennia. • Coal smoke contributed greatly to air pollution problems in the early days of the industrial revolution. • The “excessive” use of fossil fuels in the modern life causes urban air pollution around the globe and contributes dominantly to the increases in green house gases.
Open-fire biomass cooking is common in developing country villages.
Today, exposure indoors to coal and biomass smoke affects more than 65% of the Chinese population, and about half of the world’s population
Smith et al 2000, Zhang et al 2000
Smoke (point) vs. Smog (area) • Biomass smoke • Coal smoke • Tobacco smoke • etc
Smog – Regional air pollution June 2006, Ba Da Ling, Beijing
Question The word “smog” was first used to describe Los Angeles air. True or False?
False • “Smog” was first used to describe the “smoky fog” in London in the early 1900s. • However, the word has been associated with Los Angeles since the 1940s.
The London Smog* * Smog = Smoke + Fog
Daytime in London, December 1952 Particle levels – 3,000 mg/m3 Source: National Archives
Sulfurous (London) Smog vs. Photochemical (Los Angeles ) Smog Photochemical smog: HC + NOx + UV = Smog (O3 + PM + aldehydes, + etc)
Modern Air Pollution Control Regulations In U.K, 1956 - Clean Air Act:Introduced Smoke control Areas, controlled chimney heights. Prohibited emission of dark smoke from chimneys, with some exceptions. In U.S. Clean Air Act of 1970, establishment of EPA and ….
Question vehicle miles driven, cars, trucks, ships, planes, trains, people, homes, power used,… MORE …but LA air is getting cleaner! True or False?
Watertown Portage Steubenville St. Louis Topeka Kingston Harvard Six Cities Studies
Decreasing mortality rate ratios & decreasing pollution 1974 – 1989 (red letter) S: Steubenville H: Kingston L: St. Luis W: Watertown T: Topeka P: Portage S H L T W 1990 – 1998 (black letter) P Laden F, et al. Reduction in fine particulate air pollution and mortality: Extended follow-up of the Harvard Six Cities study. Am J Respir Crit Care Med. 2006 173(6):667-72
Fine-Particulate Air Pollution and Life Expectancy in the United States. Arden Pope, III, Ph.D., Majid Ezzati, Ph.D., and Douglas W. Dockery, Sc.D N Engl J Med 2009;360:376-86 Reductions in air pollution accounted for up to 15% of increased life expectancy since 1970 Clean Air Act (2.7 years)
Outdoor Air Pollution and health in the Developing Countries of Asia: A Comprehensive Review Heath Effects Institute www. healtheffects.org
Air pollution levels in many Chinese cities far exceed health based air quality standards
5-yr Average PM10, SO2 and NO2 (2000-2004) 5-yr average PM10, SO2 and NO2 concentrations in selected Asian cities Standards from WHO air quality guideline, 2005 Global Update (WHO 2006): PM10 annual average, 20 μg/m3; SO2 24-hr average, 20 μg/m3; and NO2 annual average, 40 μg/m3
Urban populations Urban populations in the world and various regions of Asia, including future projections (Data compiled from United Nations Economic and Social Affairs 2006)
Total Primary Energy Consumption in Asia, 1990-2005 The energy use index is a unitless measure of total primary energy consumption for which the value in 1990 is equal to 100 Values for All Asia are Weighted averages of the regions (Data compiled from International Energy Agency 2007)
Fuel Consumption in Transportation in Asia, 1990-2005 The energy use index is a unitless measure of total primary energy consumption for which the value in 1990 is equal to 100. Jet fuel is excluded. Values for All Asia are Weighted averages of the regions (Data compiled from International Energy Agency 2007)
Vehicle inventory of Beijing (unit: 104) (data source: http://www.bjjtgl.gov.cn/publish/portal0/tab118/)
January PM2.5 concentrations measured at US Embassy in Beijing
On Scale of 0 to 500, Beijing’s Air Quality Tops ‘Crazy Bad’ at 755!! Fashionably masked women on Saturday outside an amusement park in Beijing. The WHO has standards that judge an air-quality score above 500 to be more than 20 times the level of PM in the air deemed safe. By Edward Wong Published: January 12, 2013
Global ambient PM2.5 Population-weighted geometric mean concentrations (µg/m3) Global 20 North America 10 East Asia 34 van Donkelaar A et al. 2010. Global Estimates of Ambient Fine Particulate Matter Concentrations from Satellite-based Aerosol Optical Depth: Development and Application. Environ Health Perspect :-. doi:10.1289/ehp.0901623
Death (in millions) Attributable to Selected Risk Factors, Worldwide (GDB 2012) Predominantly in LDCs, 65% in Asia alone
Disability-Adjusted Life-Years (DALY, in millions) Attributable to Selected Risk Factors, Worldwide
The Beijing HEART Study Health Effects of Air Pollution Reduction Trial
July 13, 2001 • International Olympic Committee awarded Beijing to host 2008 Summer Olympics • Beijing promised to make air quality during the Olympics comparable to air quality in previous host cities.
The total cost of Beijing Olympics is around 43 billion USD with 1.8 billion of construction, ~ 9 billion for air quality improvements. http://www.technotraits.com/2008/08/21-amazing-facts-about-beijing-olympics-2008/
Before full-scale control Full-scale control Post full-scale control • Finished before June 30) • Relocating heavy industrial polluters, etc. Capital Steel factory and other factories, near Beijing; install desulfurization facilities in factories around Beijing • Implementing low fugitive emission facilities at more than 1000 gas stations • March 1, 2008 - permanently • Introduce new vehicular emission standard, equivalent to Euro 4 • June 23 - September 19 • 50% of government cars were not allowed to run • Diesel and heavy duty vehicles not allowed to run in Beijing • Only those vehicles meeting emission standard equivalent to Euro 2 were allowed to enter Beijing • After September 20 • Lifting of regulation adopted from 20 July. • Control approximately 20% of private cars based on the last digit of plate number, to be continued until April 10, 2013 • July 20- Sept. 19, 2008 • The odd/even plate number rule for traffic control • Stricter control on vehicles entering Beijing • Reduce or stop production at certain factories surrounding Beijing • Aug. 8 – 23 and Sept. 7 – 19, 2008 • Extra 20% of governmental cars were not allowed to run • Stop outdoor construction activities • Temporarily close some gas station • Increase bus fleet and transit frequency
Pathways and Biomarkers • Pulmonary • (Inflammation & ROS) • FeNO • EBC: pH, Nitrite, MDA • Autonomic function • SBP, DBP, • Heart rate, rMSSD, SDNN, LF, • HF, LF/HF, VLF, total power Air pollutants PM2.5, EC, OC SO2, SO4, NO2, CO • Hemostasis • sCD62p, sCD40L, VWF • Systemic • (Inflammation& ROS) • Fibrinogen, RBC, WBC • 8OHDG, MDA
Pre-Olympics During-Olympics Post-Olympics 10/30/2008 7/20/2008 8/29/2008 9/20/2008 9/30/2008 6/2/2008 7/7/2008 8/4/2008 10/17/2008 6/10/2008 6/23/2008 8/15/2008 10/6/2008 V-1 V-2 V-3 V-4 V-5 V-6 Continuous pollutants measurement period Filter-based PM2.5 collection period Clinic visits 1 to 6 (V-1, V-2, V-3, V-4, V-5 and V-6)
David Q. Rich, ScD., Howard M. Kipen, MD, MPH., Wei Huang, ScD., Guangfa Wang, MD., Yuedan Wang, PhD., Ping Zhu, MD., Pamela Ohman-Strickland, PhD., Min Hu, PhD., Claire philipp, MD., Scott R. Diehl, PhD., Shou-En Lu, PhD., Jian Tong, MS., Jicheng Gong, PhD., Duncan Thomas, PhD. and Junfeng Zhang, PhD
Relative Changes in Pollutant Concentrations from Pre-Olympic Period
Relative Changes in Inflammatory and Hemostasis Biomarker Levels from the Pre-Olympic Period
Acknowledgement • Study participants • Lab and field technicians, nurses, graduate students • Funding Agencies • NIEHS: 1 R01 ES015864 • Health Effects Institute: 4760-RPFA05-3 • China Natural Science Foundation: 20637020 • Beijing Environmental Protection Bureau
Crying while breathing The Official FreshAir Can Of the Beijing Olympic Games 2008’ 2008 Beijing Olympic “100% pure” from the Bird Nest
A formula for tackling air pollution problems in China: Based on the lessons learned from the developed world: Legislations + Technology = Clean Air