Download
1 / 47
470 likes | 732 Views
Diagnostic & Visualisation. Introduction Diagnostic cdo Visualisation gnuplot GrADS GMT cdat. diagnostic cdo. 3. 5. 4. GrADS. Ferret. cdat. gmt. 2. gnuplot. ncar. idl. fetching data from data base. 1. graphic tools. Introduction Diagnostic cdos info

E N D
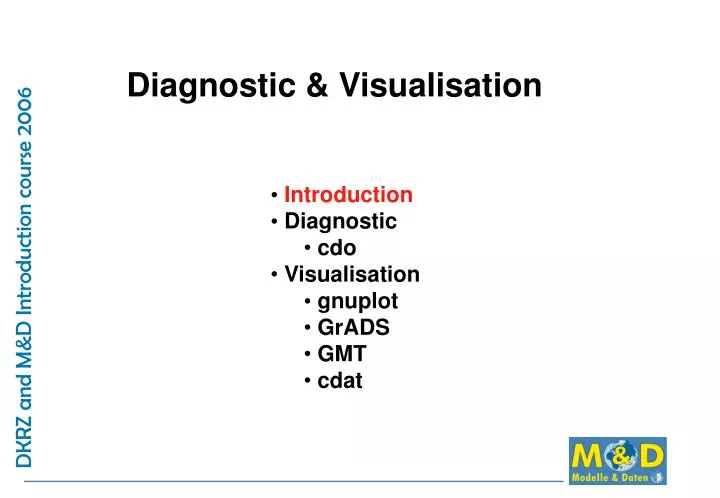
Diagnostic & Visualisation • Introduction • Diagnostic • cdo • Visualisation • gnuplot • GrADS • GMT • cdat
diagnostic cdo 3 5 4 GrADS Ferret cdat gmt 2 gnuplot ncar idl fetching data from data base 1 graphic tools
Introduction • Diagnostic • cdos • info • change formats • extract regions • extract time slices • interpolate grids • build means, mins, maxs • change values • prepare for visualisation • Visualisation • gnuplot • GrADS • GMT • cdat
There are more than 250 operators available. •File information (info, sinfo, diff, ...) •File operations (copy, cat, merge, split, ...) •Selection (selcode, selvar, sellevel, seltimestep, ...) •Missing values (setctomiss, setmisstoc, setrtomiss) •Arithmetic (add, sub, mul, div, ...) •Mathematical functions (sqrt, exp, log, sin, cos, ...) •Comparision (eq, ne, le, lt, ge, gt, ...) •Conditions (ifthen, ifnotthen, ifthenc, ifnotthenc) •Field statistic (fldsum, fldavg, fldstd, fldmin, fldmax, ...) •Vertical statistic (vertsum, vertavg, vertstd, vertmin, ...) •Time range statistic (timavg, yearavg, monavg, dayavg, ...) •Ensemble statistic (enssum, ensavg, ensstd, ensmin, ...) •Regression (detrend) •Field interpolation (remapbil, remapcon, remapdis, ...) •Vertical interpolation (ml2pl, ml2hl) •Time interpolation (inttime, intyear) CDO
CDO Usage: cdo [options] \ operator[,op[,op]] \ [-operator] \ ifile [ifile ...] [ofile] For: GRIB-, NetCDF-, ieg-, Service-, Extra- formatted files
cdo info: info, infov CDO sophie 29%cdo info zzz.grb -1 : Date Time Code Level Size Miss : Minimum Mean Maximum 1 : 24-01-01 18:00 214 0 8192 0 : 229.31 279.04 327.19 cdo info : Processed 1 variable 1 timestep. ( 0.00s 0B ) sophie 30%cdo infov zzz.grb -1 : Date Time Varname Level Size Miss : Minimum Mean Maximum 1 : 24-01-01 18:00 var214 0 8192 0 : 229.31 279.04 327.19 sophie 33%cdo -f nc copy zzz.grb zzz.nc cdo copy : Processed 1 variable 1 timestep. ( 0.01s 0B ) sophie 34%cdo infov zzz.nc -1 : Date Time Varname Level Size Miss : Minimum Mean Maximum 1 : 24-01-01 18:00 var214 0 8192 0 : 229.31 279.04 327.19 cdo infov : Processed 1 variable 1 timestep. ( 0.00s 0B ) sophie 35%cdo -f nc -t echam4 copy zzz.grb zzz.nc cdo copy : Processed 1 variable 1 timestep. ( 0.01s 0B ) sophie 36%cdo infov zzz.nc -1 : Date Time Varname Level Size Miss : Minimum Mean Maximum 1 : 24-01-01 18:00 tsmax 0 8192 0 : 229.31 279.04 327.19 cdo infov : Processed 1 variable 1 timestep. ( 0.00s 0B )
cdo info: map sophie 28%cdo sellonlatbox,-10,30,35,70 tsmax.grb tsmaxeuropa.grb sophie 29%cdo map tsmaxeuropa.grb CDO 00000000011111 12345678901234 01 44455555533211 01 02 45555555332211 02 03 55566533333322 03 04 66666433334432 04 05 64566665455332 05 06 55566655553222 06 07 76555432222210 07 08 7765432101100m 08 09 77744332211111 09 10 75445884332228 10 11 65568888888588 11 12 8889899M899788 12 00000000011111 12345678901234 0=[+2.611e+02,+2.656e+02] 1=[+2.656e+02,+2.688e+02] 2=[+2.688e+02,+2.720e+02] 3=[+2.720e+02,+2.752e+02] 4=[+2.752e+02,+2.784e+02] 5=[+2.784e+02,+2.816e+02] 6=[+2.816e+02,+2.848e+02] 7=[+2.848e+02,+2.880e+02] 8=[+2.880e+02,+2.912e+02] 9=[+2.912e+02,+2.929e+02] *=0 .=miss m=min=+2.611e+02 M=max=+2.929e+02
cdo formats: -f converting a GRIB-file to NetCDF... CDO cdo -r -f nc -t echam4 copy zzz.grb zzz.nc -r relative time axis -fnc output format is netcdf -t echam4 use parameter table echam4 converting a GRIB-file to extra... cdo -f ext copy zzz.grb zzz.ext -fext output format is extra output is a formatted text file... cdo outputf,f8.3,5 zzz.grb zzz.asc f8.3 fortran format convention 5 values per line
interpolate a curve linear (extra file) to a regular grid (NetCDF) (MPI-OM1 to regular 360*180 grid for CMOR) CDO cdo -t mpiom1 -f nc setgrid,grob15s.nc \ -selindexbox,2,255,1,220 -setgrid,r256x220 \ filein.ext inter.nc cdo remapcon,r360x180 inter.nc fileout.nc
example: piping, missing_values, etc CDO cdo -f ext daymean MSLP.grb A1_psl cdo -f ext daymin T2MIN.grb A1_tasmin cdo -f ext daymax T2MAX.grb A1_tasmax cdo -f ext add -daymean APRL.grb -daymean APRC.grb A1_pr cdo -f ext sub -daymean TRADS.grb \ -daymean TRADSU.grb A1_rlds cdo -f ext sub -daymean SRADS.grb \ -daymean SRADSU.grb zwisch1_rsds cdo gtc,0.0 zwisch1_rsds zwisch2_rsds cdo setmisstoc,0.0 -ifthen zwisch2_rsds \ zwisch1_rsds A1_rsds cdo -f ext mulc,-1. -daymean AHFL.grb A1_hfls ifthen = i2(t,x) if i1 != 0 = miss if i1 = 0 gtc = 1 if i1 > 0 = 0 if i1 <= 0
example: preparing for excel CDO Step 1: time selection and download from data base jblob -datasetname EH4OPYC_TPREC -rmin 71941 -rmax 93544 Step 2: daily mean: cdo daymean EH4OPYC_TPREC_71941-93544.grb EH4OPYC_TPREC_day.grb Step 3: select region: cdo sellonlatbox,239,251,48,55 EH4OPYC_TPREC_day.grb \ EH4OPYC_TPREC_daycs.grb Step 4: set values < 0 to 0,change from ms-1 to mmd-1: cdo gtc,0.0 EH4OPYC_TPREC_daycs.grb EOmask cdo setmisstoc,0.0 -ifthen EOmask EH4OPYC_TPREC_daycs.grb \ EH4OPYC_TPREC_erg.grb cdo mulc,86400000 EH4OPYC_TPREC_erg.grb EH4OPYC_TPREC_mmd.grb Step 5: convert from GRIB to ascii: cdo outputf,%10.4f,5 EH4OPYC_TPREC_mmd.grb > EH4OPYC_TPREC.asc Step 6:convert from mac to windows (interactive editor) Step 7:pack: gzip EH4OPYC_22723GSDIO_TPREC.win.asc
cdo gradsdes: GrADS description file CDO sophie 25% more zzz.asc # File = zzz.nc # Name = T_2M # Code = -1 # Level = 2 # Date = 1950-01-01 # Time = 03:00 # > -Z287.575 -10.7 34.5 -10.5 34.5 -10.5 34.7 -10.7 34.7 -10.7 34.5 > -Z287.542 -10.5 34.5 -10.3 34.5 -10.3 34.7 -10.5 34.7 -10.5 34.5 ..... cdo gradsdes zzz.grb creates zzz.ctl ---the GrADS description file zzz.gmp ---the INDEX file cdo outputbounds zzz.grb > zzz.txt creates
cdo: infos, downloads, installations CDO Current officially released version is cdo 0.9.11 http://www.mpimet.mpg.de/fileadmin/software/cdo/ SUN ( Solaris 8): /client/bin SUN (Solaris 10)(zetta, jango): /pf/k/k204016/bin LINUX: /client/bin or local installations ( LINUX, Mac OS X): configure --with-netcdf=/sw make
Introduction • Diagnostic • cdos • Visualisation • gnuplot • timeseries daily & monthly • 2d field with contour & pm3d • installation, etc... • GrADS • GMT • cdat
cdo + gnuplot for timeseries cdo sellonlatbox,-10,30,35,70 -monmean TSMAX.grb eh5_mon_europe.grb cdo sellonlatbox,-10,30,35,70 $FILE eh5_day_europe.grb cdo info eh5_mon_europe.grb | tail +2 | head -12 \ | cut -c 10-19,72-79 > eur_mon.asc cdo info eh5_day_europe.grb | tail +2 | head -365 \ | cut -c 10-19,72-79 > eur_day.asc sophie 27%cdo info EH4_OPYC_SRES_A2_TSMAX_day.grb -1 : Date Time Code Level Size Miss : Minimum Mean Maximum 1 : 24-01-01 18:00 214 0 8192 0 : 229.31 279.04 327.19 2 : 24-01-02 18:00 214 0 8192 0 : 227.92 279.11 332.09 3 : 24-01-03 18:00 214 0 8192 0 : 228.69 279.23 331.56 4 : 24-01-04 18:00 214 0 8192 0 : 227.97 279.06 328.30 5 : 24-01-05 18:00 214 0 8192 0 : 228.06 278.88 326.79
cdo + gnuplot for timeseries if (-e REINDA) rm REINDA cat > REINDA << ENDE set terminal post color set xdata time set timefmt "%Y-%m-%d" set format x "%m" set output "eur_mon_day.ps" plot "eur_day.asc" u 1:2 title "daily mean" w l , \ "eur_mon.asc" u 1:2 title "monthly mean" w l quit ENDE gnuplot < REINDA
cdo + gnuplot for 2d field cdo selrec,1,1 EH4_OPYC_SRES_A2_TSMAX_day.grb tsmax.grb cdo griddes tsmax.grb > tsmax.grid cdo -f ext copy tsmax.grb tsmax.ext f90 -o gp.x gp.f90 gp.x produces a file tsmax.asc: sophie 40%more tsmax.asc 0.0000 87.8638 262.2228 2.8125 87.8638 262.5333 5.6250 87.8638 262.8868 8.4375 87.8638 263.1720 11.2500 87.8638 263.4376 14.0625 87.8638 263.7111 16.8750 87.8638 263.5919 ..... gp.f90: reads tsmax.ext (tsmax) reads tsmax.grid (lon, lat) writes ascii file (lon, lat, tsmax)
gnuplot for 2d field (pm3d only version 4.0) gnuplot gnuplot> set pm3d gnuplot> unset surface gnuplot> set contour base gnuplot> set view 0,0,1.2,1.2 gnuplot> set palette model RGB gnuplot> set palette defined \ ( 0 "#0033ff", 2 "#ffff33", 3 "#ffcccc", 5 "#ff0033") gnuplot> splot [0:360][-90:90][220:330] "tsmax.asc" with pm3d gnuplot> set term postscript color gnuplot> set output "gnutemp.ps" gnuplot> replot gnuplot> quit
gnuplot: infos, downloads, installations Current officially released version is gnuplot 4.0 http://www.gnuplot.info/ http://www.gnuplot.info/download.html cross (version 3.7) : /usr/bin sun solaris (version 3.7) : /client/bin LINUX (version 3.7) : /usr/bin
Introduction • Diagnostic • cdos • Visualisation • gnuplot • GrADS • plot with default values • plot with different colours • plot with frames • plot with additional text • plot with vectors • animation • installation, etc... • GMT • cdat
'reinit' 'set vpage 0 8.5 0 11' 'set display color white' 'clear' * 'sdfopen $FILE1' * 'set lon -180 180' 'set gxout shaded' 'set parea 0.5 6.5 0.5 5.25' 'set t 1' 'display sic' 'draw title sea ice cover Jan' 'set lon -180 180' 'set gxout shaded' 'set parea 0.5 6.5 5.75 10.5' 'set t 8' 'display sic' 'draw title sea ice cover Aug' * 'run cbar.gs' 'printim icex2.gif gif x480 y640 white'
additive color system function palette() ***************************** * * color palette fuer arktis * weiss-tuerkis-werte * Nr red green blue 'set rgb 16 240 250 250' 'set rgb 17 225 240 245' 'set rgb 18 210 230 240' 'set rgb 19 195 220 235' 'set rgb 20 180 210 230' 'set rgb 21 165 200 225' 'set rgb 22 150 190 220' 'set rgb 23 135 180 215' 'set rgb 24 120 170 210' 'set rgb 25 105 160 205' 'set rgb 26 90 150 200' 'set rgb 27 75 140 195' 'set rgb 28 60 130 190' 'set rgb 29 45 120 185' 'set rgb 30 30 110 180' 'set cmin 0' 'set cmax 100' 'set clevs 8 16 24 32 40 48 56 64 \ 72 80 88 96' 'set ccols 16 17 18 19 20 21 22 23 \ 24 25 26 27 28 29'
'reinit' 'set vpage 0 8.5 0 11' 'set display color white' 'clear' 'run palette.arktis.gs' 'sdfopen sic_O1_1860-2000.nc' 'set cmin 0' 'set cmax 100' 'set clevs 8 16 24 32 ... 64 72 80 88 96' 'set ccols 16 17 ...23 24 25 26 27 28 29' 'set lon -180 180' 'set gxout shaded' 'set parea 0.5 6.5 0.75 4.5' 'set t 1' 'display sic' 'draw title sea ice cover Jan' 'set cmin 0' 'set cmax 100' 'set clevs 8 16 24 32 ...64 72 80 88 96' 'set ccols 16 17 ...23 24 25 26 27 28 29' 'set lon -180 180' 'set gxout shaded' 'set parea 0.5 6.5 5.5 9.25' 'set t 8' 'display sic' 'draw title sea ice cover Aug' 'run cbar.gs'
'reinit' 'set vpage 0 8.5 0 11' 'set display color white' 'clear' 'run palette.arktis.gs' * 'sdfopen $FILE1' * 'draw rec 0.5 0.5 6.5 5.25' 'draw string 0.6 0.6 first window' 'draw rec 0.5 5.75 6.5 10.5' 'draw string 0.6 5.85 second window' 'draw rec 7.0 2 7.7 9' * 'set cmin 0' 'set cmax 100' 'set clevs 8 16 24 32 ... 64 72 80 88 96' 'set ccols 16 17 ...23 24 25 26 27 28 29' 'set lon -180 180' 'set gxout shaded' 'set parea 0.5 6.5 0.5 5.25' 'set t 1' 'display sic' 'draw title sea ice cover Jan'
'set cmin 0' 'set cmax 100' 'set clevs 8 16 24 32 ...64 72 80 88 96' 'set ccols 16 17 ...23 24 25 26 27 28 29' 'set lon -180 180' 'set gxout shaded' 'set parea 0.5 6.5 5.75 10.5' 'set t 8' 'display sic' 'draw title sea ice cover Aug' * 'run cbar.gs' 'set string 4 c 2 0' 'draw string 7.35 8.9 %' 'set font 4' 'set string 2 l 30 55' 'set strsiz 1' 'draw string 0.6 1 GrADS 1.9b' 'printim icex2.gif gif x480 y640 white'
#!/bin/tcsh # # Script fuer ein gradsbild # set WORK = "$HOME/GRADStest" set FILE1 = uas_A1.nc set FILE2 = vas_A1.nc set FILE3 = speed_A1.nc # cd $WORK # cat > REIN.gs <<ENDE 'reinit' 'set vpage 0 11 0.5 8.5' 'set display color white' 'clear' 'run palette.joerg3.gs' * 'sdfopen $FILE1' 'sdfopen $FILE2' 'sdfopen $FILE3' 'set parea 1 10 1 8' 'set map 2 1 10' * 'set cmin 0' 'set cmax 27' 'set clevs 3 6 9 12 15 18 21 24 27' 'set ccols 38 39 40 ... 46 47 48' * 'set lon -30 40' 'set lat 20 75' 'set gxout shaded' 'display uas.3' 'set gxout vector' 'set t 1' 'set arrscl .3 10' 'display uas.1;vas.2' * 'run cbar.gs' 'draw string 1.9 0.2 Windspeed und Direction' 'printim gifimage.out gif x800 y600 white' * 'quit' * ENDE # gradsnc -lc 'run REIN.gs' #
#!/bin/tcsh -vx set work = $HOME/DKRZcourse/GRADStest set bild = $work/gifs set ifile = templev.nc cd $work foreach z ( 6 ... 5720) cat > REINDA << ENDE 'reinit' 'set vpage 0 11 0.5 8.5' 'set display color white' 'clear' 'run palette.joerg3.gs' 'sdfopen $ifile' 'set parea 1 10 1 8' 'set cmin 270' 'set cmax 302' 'set clevs 270 273 276 279 282 285 288 291 293 296 299 302' 'set ccols 37 38 39 40 41 42 43 44 45 46 47 48 49 50' 'set gxout shaded' 'set lev $z' 'display thetao' 'run cbar.gs' 'draw string 3 0.2 Temp from surface to bottom: $z' 'printim ./gifs/temp.$z.gif gif x600 y400 white' 'quit' ENDE gradsnc -lbc 'run REINDA' rm REINDA end set loopdim z set lev 6 5720 set z 1 40 display thetao
cd ./gifs foreach z ( 6 17 27 37 47 57 69 83 100 123 150 183 220 263 310 363 420 485 \ 560 645 740 845 960 1085 1220 1365 1525 1700 \ 1885 2080 2290 2525 2785 3070 3395 3770 4195 4670 5170 5720 ) if ( $z < 10 ) then mv temp.$z.gif temp.000$z.gif else if ( $z < 100 ) then mv temp.$z.gif temp.00$z.gif else if ( $z < 1000 ) then mv temp.$z.gif temp.0$z.gif endif end temp.0006.gif temp.0150.gif temp.0740.gif temp.2290.gif temp.0017.gif temp.0183.gif temp.0845.gif temp.2525.gif temp.0027.gif temp.0220.gif temp.0960.gif temp.2785.gif temp.0037.gif temp.0263.gif temp.1085.gif temp.3070.gif temp.0047.gif temp.0310.gif temp.1220.gif temp.3395.gif temp.0057.gif temp.0363.gif temp.1365.gif temp.3770.gif temp.0069.gif temp.0420.gif temp.1525.gif temp.4195.gif temp.0083.gif temp.0485.gif temp.1700.gif temp.4670.gif temp.0100.gif temp.0560.gif temp.1885.gif temp.5170.gif temp.0123.gif temp.0645.gif temp.2080.gif temp.5720.gif convert -delay 20 temp.*.gif ani20.gif
GrADS: infos, downloads, installations Current officially released version is GrADS 1.8s11 http://www.iges.org/grads/ http://www.iges.org/grads/downloads.html cross (version 1.8sl11) : /pool/ia64/grads/ia32/bin sun solaris (version 1.8sl9): /client/bin LINUX (version 1.8) : /client/bin Running Version 1.9b4: MacOS X.4 setenv GADDIR ~/grads-1.9b4/data setenv GRADSDIR ~/bin
Introduction • Diagnostic • cdos • Visualisation • gnuplot • GrADS • GMT • plot europe • plot europe "conic" • plot europe "and world" • plot ocean data on curve linear grid • installation, etc... • cdat
cdo outputbounds ifile > ofile.asc psbasemap -R-15/40/35/75 -JM6i \ -B15/5:."Europa mit GMT":\ -P -K >! zzz.ps psxy -R -J -M zzz.asc -L \ -Czzz.cpt -P -O -K >> zzz.ps pscoast -R -J -Dc -W0.5p -P -O >> zzz.ps
cdo outputbounds ifile > ofile.asc makecpt -Crainbow -T240/300/3 > zzz.cpt psbasemap -R-15/40/35/75 -JB-10/30/35/65/6i \ -B15/5:."Europe Albers Conic": -P -K >! zzz.ps psxy -R -J -M zzz.asc -L -Czzz.cpt -P -O -K >> zzz.ps pscoast -R -J -Dc -W0.5p -P -O >> zzz.ps
#!/bin/tcsh # makecpt -Crainbow -T240/300/3 > zzz.cpt pscoast -R-180/180/-90/90 -JG10/35/6i -Bg30/g15 -Dc \ -A5000 -G255/255/255 \ -S150/50/150 -P -K >! zz1.ps psxy -R-12/37/35/70 -M zzz.asc -J -L -O -K -Czzz.cpt >> zz1.ps pscoast -R-180/180/-90/90 -JG10/35/6i -Bg30/g15 -Dc -A5000 -W0.5p \ -P -O >> zz1.ps
#!/bin/tcsh -vx set IFILE = $1 set OFILE = $2 set GFILE = $OFILE:r.gmt set CFILE = colorj.cpt set PFILE = $OFILE:r.ps #change from extra to netcdf and cutting the overlaps cdo -t mpiom1 -f nc setgrid,$HOME/cdogrids/grob15s.nc \ -selindexbox,2,255,1,220 \ -setgrid,r256x220 $IFILE $OFILE #create inputfile for gmt cdo outputbounds $OFILE > $GFILE #Cylindrical equidistant GMT output psbasemap -Rd -JQ0/8.0i -X1.5i -Y2.0i \ -Ba60f30/a30f15:."MPIOM ZO - Height above geoid": \ -K >! $PFILE psxy -R -J -M $GFILE -L -C./$CFILE -W0.5p \ -O -K >> $PFILE pscoast -R -J -W0.5p -G102/187/80 -Dc \ -O -K >> $PFILE psbasemap -R -J -Bg30/g15 -U/0.0i/-1.6i/"joergwegner" \ -O -K >> $PFILE psscale -C./$CFILE -D4.0i/-0.5i/4.0i/0.2ih -B2/:"[m]": \ -O >> $PFILE
psbasemap -Rd -JG-35/50/6.0i -X1.0i -Y2.0i \ -Ba60f30/a30f15:."MPIOM ZO - Height above geoid":\ -P -K >! $PFILE
gmt: infos, downloads, installations Current officially released version is gmt 4.1 http://gmt.soest.hawaii.edu/ http://gmt.soest.hawaii.edu/ cross (version ?) : not installed sun solaris (version 3.41) : /client/bin LINUX (version ?) : ?
Introduction • Diagnostic • cdos • Visualisation • gnuplot • GrADS • GMT • cdat • overview • example • installation, etc...
#!/usr/bin/env python import cdms, vcs, cdutil, Numeric, genutil, os, sys from cdms import MV from Numeric import * # f=cdms.open('clmt.nc', 'r') temp = f('T', time = ('1960-3-7 3:0:0.0', '1960-3-7 3:0:0.0'),\ level = (29, 29),\ rlat = (-22.0275, 22.1925),\ rlon = (-24.8825, 17.0275),\ squeeze = 0, order = '0123') lob = f('lon') lab = f('lat') tla = temp.getLatitude() tlo = temp.getLongitude() # b=cdms.open('zbounds.bin','r') labb=b('variable_2195043') lobb=b('variable_2195044') la=cdms.createVariable(labb) lo=cdms.createVariable(lobb) print la.shape print lo.shape tla.setBounds(la) tlo.setBounds(lo) vis=vcs.init() te=temp[:] # vis.plot(te) vis.gif('zb3.eu0123.gif','r','l') cdat example on CLM output loading bounds for lon and lat from file and plotting temperature
cdat: infos, downloads, installations Current officially released version is cdat 4.0 http://www-pcmdi.llnl.gov/software/support.php http://sourceforge.net/project/showfiles.php?group_id=11356 cross (version 4.0) : no Fortran support, no postscript output sun solaris (version 4.0) : no Fortran support LINUX (version ?) : not installed Running Version 4.0: MacOS X.4, LINUX (SUSE, Debian)(with gcc 4.0 or higher) setenv CDATHOME "/pf/k/k204083/cdat" setenv PYTHONHOME "/pf/k/k204083/cdat" setenv PYTHONPATH "$CDATHOME/lib/python2.4:$CDATHOME/bin: \ $CDATHOME/lib:." # set my_path = ( $PINGO ./ $CDO $PYTHONPATH )