Download
1 / 16
160 likes | 186 Views
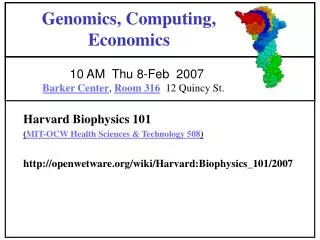
Genomics, Computing, Economics. 10 AM Tue 20-Feb. Harvard Biophysics 101 ( MIT-OCW Health Sciences & Technology 508 ) http://openwetware.org/wiki/Harvard:Biophysics_101/2007. Class outline. (1) Topic priorities for homework since last class

E N D
Genomics, Computing, Economics 10 AM Tue 20-Feb Harvard Biophysics 101 (MIT-OCW Health Sciences & Technology 508) http://openwetware.org/wiki/Harvard:Biophysics_101/2007
Class outline (1) Topic priorities for homework since last class (2) Quantitative exercises: psycho-statistics, combinatorials, exponential/logistic, bits, association & multi-hypotheses, FBA (3) Project level presentation & discussion Personalized Medicine & Energy Metabolism (4) Discuss communication/presentation tools (5) Topic priorities for homework for next class
Steady-state flux optima RC Flux Balance Constraints: RA< 1 molecule/sec (external) RA = RB(because no net increase) x1 + x2< 1 (mass conservation) x1 >0 (positive rates) x2 > 0 C x1 RB RA A B x2 D RD x2 Max Z=3 at (x2=1, x1=0) Feasible flux distributions Z = 3RD + RC (But what if we really wanted to select for a fixed ratio of 3:1?) x1
Applicability of LP & FBA • Stoichiometry is well-known • Limited thermodynamic information is required • reversibility vs. irreversibility • Experimental knowledge can be incorporated in to the problem formulation • Linear optimization allows the identification of the reaction pathways used to fulfil the goals of the cell if it is operating in an optimal manner. • The relative value of the metabolites can be determined • Flux distribution for the production of a commercial metabolite can be identified. Genetic Engineering candidates
Precursors to cell growth • How to define the growth function. • The biomass composition has been determined for several cells, E. coli and B. subtilis. • This can be included in a complete metabolic network • When only the catabolic network is modeled, the biomass composition can be described as the 12 biosynthetic precursors and the energy and redox cofactors
in silico cells E. coli H. influenzae H. pylori Genes 695 362 268 Reactions 720 488 444 Metabolites 436 343 340 (of total genes 4300 1700 1800) Edwards, et al 2002. Genome-scale metabolic model of Helicobacter pylori 26695. J Bacteriol. 184(16):4582-93. Segre, et al, 2002 Analysis of optimality in natural and perturbed metabolic networks. PNAS 99: 15112-7. (Minimization Of MetabolicAdjustment )http://arep.med.harvard.edu/moma/
Where do the Stochiometric matrices (& kinetic parameters) come from? EMP RBC, E.coli KEGG, Ecocyc
Biomass Composition ATP GLY LEU coeff. in growth reaction ACCOA NADH FAD SUCCOA COA metabolites
Flux ratios at each branch point yields optimal polymer composition for replication x,y are two of the 100s of flux dimensions
C009-limited 200 WT (LP) 180 7 8 160 140 9 120 10 Predicted Fluxes r=0.91 p=8e-8 100 11 14 13 12 3 1 80 60 40 16 20 2 6 5 15 4 17 18 0 0 50 100 150 200 Experimental Fluxes 250 250 Dpyk (LP) Dpyk (QP) 200 200 18 7 r=0.56 P=7e-3 8 r=-0.06 p=6e-1 150 150 7 8 2 Predicted Fluxes Predicted Fluxes 10 9 13 100 9 100 11 12 3 1 14 10 14 13 11 12 3 50 50 5 6 4 16 16 2 15 5 6 18 17 15 17 0 0 4 1 -50 -50 -50 0 50 100 150 200 250 -50 0 50 100 150 200 250 Experimental Fluxes Experimental Fluxes
Competitive growth data: reproducibility Correlation between two selection experiments Badarinarayana, et al. Nature Biotech.19: 1060
Competitive growth data On minimal media negative small selection effect C 2 p-values 4x10⁻³ 1x10⁻⁵ LP QP Novel redundancies Position effects Hypothesis: next optima are achieved by regulation of activities.
Non-optimal evolves to optimal Ibarra et al.Nature. 2002 Nov 14;420(6912):186-9. Escherichia coli K-12 undergoes adaptive evolution to achieve in silico predicted optimal growth.
Further optimization readings Duarte et al. reconstruction of the human metabolic network based on genomic and bibliomic data. Proc Natl Acad Sci U S A. 2007 Feb 6;104(6):1777-82. Joyce AR, Palsson BO. Toward whole cell modeling and simulation: comprehensive functional genomics through the constraint-based approach. Prog Drug Res. 2007;64:265, 267-309. Review. Herring, et al. Comparative genome sequencing of Escherichia coli allows observation of bacterial evolution on a laboratory timescale. Nat Genet. 2006 Dec;38(12):1406-12. Desai RP, Nielsen LK, Papoutsakis ET. Stoichiometric modeling of Clostridium acetobutylicum fermentations with non-linear constraints. J Biotechnol. 1999 May 28;71(1-3):191-205.