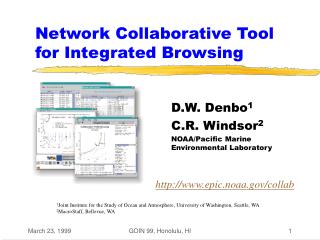
Network Collaborative Tool for Integrated Browsing
This collaborative tool leverages web and Java technologies to provide scientists with an interactive environment for exploring in situ data, co-plotting profiles from multiple archives, annotating data, querying values and metadata, and interacting with data. It borrows from Habanero and NOAAServer projects for distributed communications and data access. The tool features Java graphics, NCSA Habanero API, and JBrowse architecture for remote and local data files access.

Network Collaborative Tool for Integrated Browsing
E N D
Presentation Transcript
Network Collaborative Tool for Integrated Browsing D.W. Denbo1 C.R. Windsor2 NOAA/Pacific Marine Environmental Laboratory http://www.epic.noaa.gov/collab 1Joint Institute for the Study of Ocean and Atmosphere, University of Washington, Seattle, WA 2MacroStaff, Bellevue, WA GOIN 99, Honolulu, HI
Introduction • Inter-institutional collaborations are awkward between observational scientists. • Traditional techniques for remote collaborations regarding in situ data are inflexible and static. • Web technologies combined with Java present new opportunities for collaboration. GOIN 99, Honolulu, HI
Design Goals • Provide a interactive and collaborative environment for in situ data exploration. • Allow co-plotting of profile data from multiple geographically distributed archives. • Allow profile data from local files (netCDF) to be read. • Enable scientists to interactively annotate data. • Highlight individual profiles • add text, arrows, lines, etc • Enable scientists to interact with the data. • Query values • Query metadata (geographic location, etc.) GOIN 99, Honolulu, HI
Approach Leverage (borrow) heavily from existing development efforts • Habanero, distributed interpersonal communications utilizing multi-user, collaborative work environments. • NOAAServer, a project whose purpose is to present to users a centralized and unified view of NOAA’s environmental information databases. GOIN 99, Honolulu, HI
NOAAServer • Provides a mechanism to locate datasets distributed over many servers (NOAA wide). • Uses an object oriented data model and CORBA/IIOP implementation of data access. • Java Graphics for display of in situ data. • More information at: http://www.joss.ucar.edu/NOAAServer/ GOIN 99, Honolulu, HI
NCSA Habanero • Developers API. Framework under which a collaborative tool can be developed. • Collaborative tools • Whiteboard • Text Editor • WWW Shared Session • Audio Chat • Available at:http://www.ncsa.uiuc.edu/SDG/Software/Habanero/ GOIN 99, Honolulu, HI
JBrowse Architecture Remote data files Local data files JBrowse client Local protocols netCDF CORBA IIOP CORBA Server IIOP Habanero communications Habanero Environment GOIN 99, Honolulu, HI
Java Graphics • Two coordinate systems • physical • user • Three main components • Pane • Layer • LineKey • SGLabel • Graph • Axes • Renderer More information at:http://www.epic.noaa.gov/NOAAServer/sgt GOIN 99, Honolulu, HI
NOAAServer CORBA Servers GOIN 99, Honolulu, HI
Habanero Event Handling 1 John’s Client Jill’s Client Jorge’s Client 1. Jorge selects a profile 2. JBrowse sends event to Habanero 3. Habanero informs all clients of event 2 3 3 3 Habanero Environment GOIN 99, Honolulu, HI
Demonstration • Scenario: Two researchers looking at recent CTD measurements taken near 155W 0N. GOIN 99, Honolulu, HI
What’s Next? • Make available to scientists for testing. • Modify design to: • Address user feedback • Include new collaborative features • Annotate graph • “post-it notes” • Include new data types • Time series • Access climate databases GOIN 99, Honolulu, HI