Win Loss Analysis Tool
50 likes | 115 Views
Get this template plus 350 other premium business tools & templates at www.demandmetric.com

Win Loss Analysis Tool
E N D
Presentation Transcript
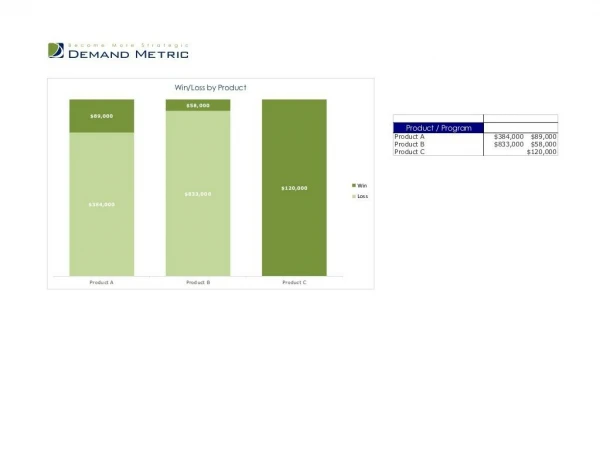
Win Loss Analysis Tool Win/Loss by Product $58,000$89,000 Sum of Amount Outcome Product / Program Loss Win Product A $384,000 $89,000 Product B $833,000 $58,000 Product C $120,000 $120,000 Win $833,000 Loss$384,000Product A Product B Product C
Prospect/Customer Industry Product / Program Close Date Outcome Amount Top Reason Secondary Reason Tertiary Reason NotesProspect 1 Healthcare Product A 2/10/09 Win $89,000 Capabilities Credibility CompetitionProspect 2 Manufacturing Product B 2/11/09 Loss $240,000 Pricing Capabilities Value PropositionProspect 3 Software Product C 2/12/09 Win $35,000 Pricing Credibility Value PropositionProspect 4 Engineering Product A 2/13/09 Loss $295,000 On-Hold Budget Lack of ResourcesProspect 5 Professional Services Product B 2/14/09 Win $58,000 Budget Value Proposition CredibilityProspect 6 Healthcare Product A 2/10/09 Loss $89,000 Customer Not Awarded Pricing CompetitionProspect 7 Manufacturing Product B 2/11/09 Loss $240,000 Pricing Capabilities Value PropositionProspect 8 Software Product C 2/12/09 Win $85,000 Value Proposition Credibility Value PropositionProspect 9 Engineering Product B 2/13/09 Loss $295,000 On-Hold Budget Lack of ResourcesProspect 10 Professional Services Product B 2/14/09 Loss $58,000 Capabilities Value Proposition Credibility Prospect/Customer Industry Product / Program Close Date Outcome Amount Top Reason Secondary Reason Tertiary Reason NotesProspect 1 Healthcare Product A 2/10/09 Win $89,000 Capabilities Credibility CompetitionProspect 2 Manufacturing Product B 2/11/09 Loss $240,000 Pricing Capabilities Value PropositionProspect 3 Software Product C 2/12/09 Win $35,000 Pricing Credibility Value PropositionProspect 4 Engineering Product A 2/13/09 Loss $295,000 On-Hold Budget Lack of ResourcesProspect 5 Professional Services Product B 2/14/09 Win $58,000 Budget Value Proposition CredibilityProspect 6 Healthcare Product A 2/10/09 Loss $89,000 Customer Not Awarded Pricing CompetitionProspect 7 Manufacturing Product B 2/11/09 Loss $240,000 Pricing Capabilities Value PropositionProspect 8 Software Product C 2/12/09 Win $85,000 Value Proposition Credibility Value PropositionProspect 9 Engineering Product B 2/13/09 Loss $295,000 On-Hold Budget Lack of ResourcesProspect 10 Professional Services Product B 2/14/09 Loss $58,000 Capabilities Value Proposition Credibility
Total Wins vs. Losses (all products)76 6 Count of Product / Program Outcome Total Loss 65 Win 44 43210 Loss Win Total Wins vs. Losses (all products)76 6 Count of Product / Program Outcome Total Loss 65 Win 44 43210 Loss Win
Top Reason for Loss Outcome Loss 17% 17% Count of Product / Program Top Reason Total Capabilities 1 On-Hold 2 Pricing 2 Customer Not Awarded 1 Capabilities On-Hold Pricing Customer Not Awarded33% 33% Top Reason for Loss Outcome Loss 17% 17% Count of Product / Program Top Reason Total Capabilities 1 On-Hold 2 Pricing 2 Customer Not Awarded 1 Capabilities On-Hold Pricing Customer Not Awarded33% 33%