Download
1 / 1
10 likes | 125 Views
50°N. 50°N. 40°N. 40°N. 30°N. 30°N. 20°N. 20°N. 10°N. 10°N. 0°N. 0°N. 10°S. 10°S. 20°S. 20°S. 30°S. 30°S. 40°S. 40°S. 10°W. 10°W. 0°W. 10°E. 20°E. 0°W. 10°E. 20°E. 30°W. 20°W. 30°W. 20°W. Variability in surface ocean DMS and isoprene in the eastern Atlantic Ocean

E N D
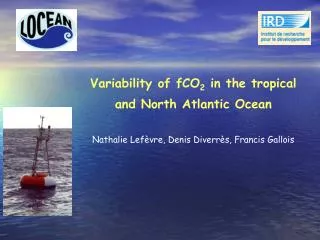
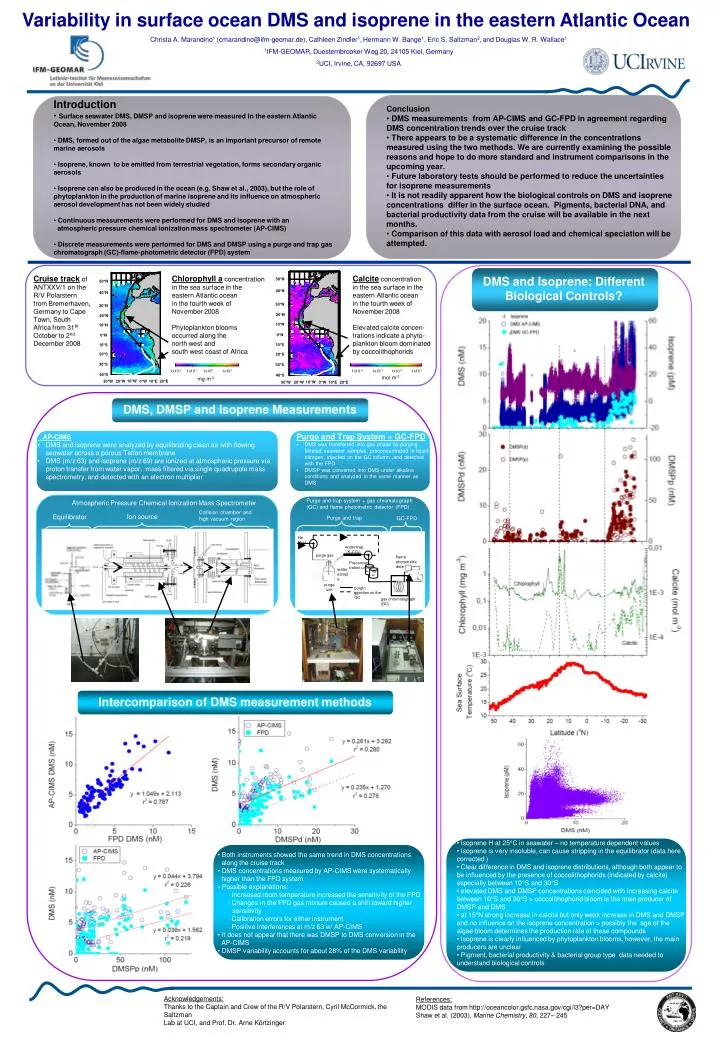
50°N 50°N 40°N 40°N 30°N 30°N 20°N 20°N 10°N 10°N 0°N 0°N 10°S 10°S 20°S 20°S 30°S 30°S 40°S 40°S 10°W 10°W 0°W 10°E 20°E 0°W 10°E 20°E 30°W 20°W 30°W 20°W Variability in surface ocean DMS and isoprene in the eastern Atlantic Ocean Christa A. Marandino1 (cmarandino@ifm-geomar.de), Cathleen Zindler1, Hermann W. Bange1, Eric S. Saltzman2, and Douglas W. R. Wallace1 1IFM-GEOMAR, Duesternbrooker Weg 20, 24105 Kiel, Germany 2UCI, Irvine, CA, 92697 USA Introduction • Surface seawater DMS, DMSP and isoprene were measured in the eastern Atlantic Ocean, November 2008 • DMS, formed out of the algae metabolite DMSP, is an important precursor of remote marine aerosols • Isoprene, known to be emitted from terrestrial vegetation, forms secondary organic aerosols • Isoprene can also be produced in the ocean (e.g. Shaw et al., 2003), but the role of phytoplankton in the production of marine isoprene and its influence on atmospheric aerosol development has not been widely studied • Continuous measurements were performed for DMS and isoprene with an atmospheric pressure chemical ionization mass spectrometer (AP-CIMS) • Discrete measurements were performed for DMS and DMSP using a purge and trap gas chromatograph (GC)-flame-photometric detector (FPD) system Conclusion • DMS measurements from AP-CIMS and GC-FPD in agreement regarding DMS concentration trends over the cruise track • There appears to be a systematic difference in the concentrations measured using the two methods. We are currently examining the possible reasons and hope to do more standard and instrument comparisons in the upcoming year. • Future laboratory tests should be performed to reduce the uncertainties for isoprene measurements • It is not readily apparent how the biological controls on DMS and isoprene concentrations differ in the surface ocean. Pigments, bacterial DNA, and bacterial productivity data from the cruise will be available in the next months. • Comparison of this data with aerosol load and chemical speciation will be attempted. Cruise track of ANTXXV/1 on the R/V Polarstern from Bremerhaven, Germany to Cape Town, South Africa from 31th October to 2nd December 2008 Chlorophyll a concentration in the sea surface in the eastern Atlantic ocean in the fourth week of November 2008 Phytoplankton blooms occurred along the north west and south west coast of Africa Calcite concentration in the sea surface in the eastern Atlantic ocean in the fourth week of November 2008 Elevated calcite concen- trations indicate a phyto- plankton bloom dominated by coccolithophorids DMS and Isoprene: Different Biological Controls? DMS, DMSP and Isoprene Measurements Purge and Trap System + GC-FPD • DMS was transferred into gas phase by purging filtrated seawater samples, preconcentrated in liquid nitrogen, injected on the GC column ,and detected with the FPD • DMSP was converted into DMS under alkaline conditions and analyzed in the same manner as DMS AP-CIMS • DMS and isoprene were analyzed by equilibrating clean air with flowing seawater across a porous Teflon membrane • DMS (m/z 63) and isoprene (m/z 69) are ionized at atmospheric pressure via proton transfer from water vapor, mass filtered via single quadrupole mass spectrometry, and detected with an electron multiplier Purge and trap system + gas chromatograph (GC) and flame photometric detector (FPD) Atmospheric Pressure Chemical Ionization Mass Spectrometer Collision chamber and high vacuum region Ion source Equilibrator Purge and trap GC-FPD He stream water trap (K2CO3) purge gas flame photometric detector (FPD) Preconcen- tration unit coo- ler water sample hea- ter purge unit purging injection on the GC gas chromatograph (GC) Intercomparison of DMS measurement methods • Isoprene H at 25°C in seawater – no temperature dependent values • Isoprene is very insoluble, can cause stripping in the equilibrator (data here corrected ) • Clear difference in DMS and isoprene distributions, although both appear to be influenced by the presence of coccolithophorids (indicated by calcite) especially between 10°S and 30°S • elevated DMS and DMSP concentrations coincided with increasing calcite between 10°S and 30°S > coccolithophorid bloom is the main producer of DMSP and DMS • at 15°N strong increase in calcite but only weak increase in DMS and DMSP and no influence on the isoprene concentration > possibly the age of the algae bloom determines the production rate of these compounds • Isoprene is clearly influenced by phytoplankton blooms, however, the main producers are unclear • Pigment, bacterial productivity & bacterial group type data needed to understand biological controls • Both instruments showed the same trend in DMS concentrations along the cruise track • DMS concentrations measured by AP-CIMS were systematically higher than the FPD system • Possible explanations: • Increased room temperature increased the sensitivity of the FPD • Changes in the FPD gas mixture caused a shift toward higher sensitivity • Calibration errors for either instrument • Positive interferences at m/z 63 w/ AP-CIMS • It does not appear that there was DMSP to DMS conversion in the AP-CIMS • DMSP variability accounts for about 28% of the DMS variability Acknowledgements: Thanks to the Captain and Crew of the R/V Polarstern, Cyril McCormick, the Saltzman Lab at UCI, and Prof. Dr. Arne Körtzinger References: MODIS data from http://oceancolor.gsfc.nasa.gov/cgi/l3?per=DAY Shaw et al. (2003), Marine Chemistry, 80, 227– 245 1x10⁻² 1x10⁻¹ 1x100 1x101 1x10⁻⁴ 1x10⁻³ 1x10⁻² 1x10⁻¹ mg m-3 mol m-3