Download

1 / 24
240 likes | 443 Views
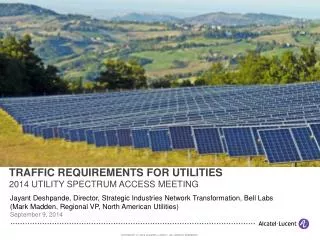
Jayant Deshpande, Director, Strategic Industries Network Transformation, Bell Labs (Mark Madden, Regional VP, North American Utilities) September 9, 2014. TRAFFIC REQUIREMENTS FOR UTILITIES 2014 UTILITY SPECTRUM ACCESS MEETING. This presentation is based on the UTC whitepaper :

E N D
Jayant Deshpande, Director, Strategic Industries Network Transformation, Bell Labs(Mark Madden, Regional VP, North American Utilities)September 9, 2014 TRAFFIC REQUIREMENTS FOR UTILITIES2014 UTILITY SPECTRUM ACCESS MEETING
This presentation is based on the UTC whitepaper: K. Budka, J. Deshpande, M. Thottan,“Estimating Smart Grid Communication Network Traffic”, A Utilities Telecom Council Whitepaper, 2014.
AGENDA Impact of Smart Grid on Grid Communications Networks Traffic Aggregation Scenarios Traffic Characterization A Transmission Substation LTE Field Area Network Assumptions Application Traffic Characteristics Implications in a 700MHz Broadband Deployment Extending to Other Bands Conclusion
FAN/NAN WAN SMART GRIDIMPACT ON UTILITY COMMUNICATIONS NETWORKS Supervisory Control and Data Acquisition (SCADA) Distribution Automation (DA) Advanced Metering Infrastructure (AMI) Teleprotection Synchrophasors Demand Response (DR) Electric Vehicle Charging Station (EVCS) Distributed Storage (DS) Mobile Workforce Dynamic Line Rating Distributed Generation (DG) Closed Circuit Television (CCTV) Application Plane Communication Plane Distribution Transmission Power Delivery Plane New grid applications drives transformation of legacy utility communication networks
Smart Grid and Other Critical Utility Applications • Supervisory Control And Data Acquisition (SCADA) – Refers to communication between Remote Terminal Units (RTU) or Intelligent Electronic Devices (IED) deployed in a substation with the SCADA Master (Control) in the utility control center. • Advanced Metering Infrastructure (AMI) – Smart meters report electrical measurements (energy, voltage, power, etc.). Frequent meter measurements are used for applications including Automated Demand Response (ADR), energy management, rate management, & power quality. • Demand Response -- Demand Response refers to actions taken by a utility to adapt to changes in demand. Some DR methods, such as ADR, occur over the timescale of seconds, others occur over the timescale of several months to years. • Distribution Automation (DA) -- DA refers to monitoring and control of IEDs deployed in the utility distribution system outside of the distribution substation. These IEDs may be deployed at reclosers, switches, and capacitor banks installed along feeders (distribution lines). • Distributed Generation -- Large-scale distributed generation (solar, wind, fuel cells, biomass and biogas, etc.) are an integral part of Smart Grid evolution. DG deployments that require monitoring and control by the utility generate network traffic. • Electric Vehicle Charging Stations -- Electric Vehicle Charging Stations that allow EVs parked at the station to discharge energy from vehicle batteries into the grid (in addition to charging EV batteries) can be considered stand-alone DS deployments. • Phasor Measurement Units (Synchrophasors) -- PMUs are special-purpose, state-of-the art IEDs that report measurement+status at very short intervals (e.g. 60 or 50 times a second). PMU measurements from transmission substations are collected and analyzed to support wide area situational awareness and control of the regional power system. • Dynamic Line Rating (DLR) -- DLR systems are being deployed to monitor environmental conditions at transmission lines using IEDs deployed at or close to transmission towers. DLR IEDs measure ambient temperature, wind, solar radiation, ice accumulation, sag, and other parameters. • Utility Engineering and Operations -- Data transfer are required for operations and engineering needs including the retrieval of sensor data for analysis, software/firmware upgrades, remote programming, and configuration of sensors, and re-registration of meters after blackouts. • Closed Circuit Television (CCTV) -- Utilities are increasingly deploying CCTV cameras at substations, Data and Control Centers, and other locations to support physical security. Video feeds from cameras are typically stored in local Digital Video Recorders (DVR). When required (such as during a security incident at a substation), one or more live video feeds may also be uploaded to the DCC. • Mobile Workforce (MWF) -- Legacy Push-To-Talk systems and VoIP. For PTT, at any time, only one member of a talk group can speak. There is often more than one talk group in the utility service area. • Utility Business Voice -- Supports voice traffic for utility personnel located in business offices, field offices, and other sites as well as for MWF personnel. Support of voice communication over the smart grid requires the use of IP-based interfaces. • Utility Business Data -- Supports business data traffic for utility personnel located in business offices, field offices and other sites as well as for MWF personnel.
GOALS • Quantify volume of trafficgenerated by grid applications • Quantify volume of trafficthat must be carried at pointsin the network where trafficis aggregated • Estimate the amount ofbroadband spectrum forField Area Networks • Service LevelAgreements (e.g., FirstNet) • Required cell capacity inother networks (private, public) • Impact of spectrum band Data critical fornetwork planning, design
ASSUMPTIONS • Smart Grid Network is an IP/MPLS network • “Uplink” traffic “downlink” traffic (most applications) • Reasonable worst case assumptions on: • Number of network endpoints • Traffic generated by each endpoint • Traffic at aggregation point = traffic from endpoints for each application • Models used to characterize application traffic • Traffic estimates also provided for gas operations • Pumping, metering and recording (M&R) stations The focus of the whitepaper and this presentation is on traffic estimation methodology. The methodology can be used in other scenarios or with different inputs (with little or no modifications to the methodology).
TRAFFIC AGGREGATION SCENARIOS LTE FANs will be analyzed inmore detail later
TRAFFIC CHARACTERIZATIONPERIODIC MEASUREMENT+STATUS Management and Control System Sensor Poll (Periodic) SCADA IED Measurement+Status (Periodic) PMU • One or more servers Supporting • SCADA Master Control • Synchrophasor Management • DLR Management • Energy Management • Demand Response • DA Master Control • Meter Data Management System Event (Asynchronous) DLR IED Control (Asynchronous) DG, DS, EVCS IED DA IED Software/Firmware Upgrade (as needed) Meter File transfer( Scheduled, on-demand)
TRAFFIC CHARACTERIZATIONPERIODIC MEASUREMENT+STATUS • Periodic messages packet formats (Up to and including Layer 2) • SCADA, DLR IED, DG, DS, EVCS, DA, and Gas SCADA: Use DNP3-like protocol • Synchrophasors: Use IEEE C37.118-2 standard • AMI: Empirical • Add fixed overhead to account for asynchronous traffic (events, file transfers) • Add Layer 1 overhead • Normal Condition: Periodic + asynchronous. Critical condition: Periodic only
TRAFFIC CHARACTERIZATIONOTHER APPLICATIONS • CCTV: fixed data rate per video stream (eg, 128 kbps, 512 kbps) • Generally stored at DVRs at locations. At most one or two live streams per location • Normal condition: no live video; Critical condition: add one live video stream • Demand Response: assume that DR traffic flows through meter • A fraction of meters sending measurements at higher frequency • All traffic critical • Mobile Workforce push-to-talk (VoIP): codec data rate = codec data rate + protocol overheads • At most one voice stream (uplink) per talk group • Normal condition: 1 talk group; Critical condition: multiple talk groups • Conversational Voice (Mobile workforce, substations, business offices, etc) • Based on Erlang-B formula using busy hour demand per user in Erlang • Codec data rate includes protocol overhead • Normal condition: 0.08 Erlang; Critical condition: 0.15 Erlang • Business data (Mobile workforce, substations, business offices, etc) • Based on average busy hour uplink data volume (in Mbps) • Same for both the normal and critical conditions • Add Layer 1 overhead
LTE FIELD AREA NETWORKS Dense Urban Urban Suburban Rural Range Traffic Load • Tower/mobile Height • Edge date rates • Frequency band • #Devices • #Substations • Application Traffic
TRAFFIC IN WIRELESS BROADBAND NETWORKSKEY ASSUMPTIONS • Number of locations and endpoints supported in LTE cell coverage area are typical of values seen in the field. • Sectorized cells (3 sectors/cell) • LTE cells are coverage-limited • Worst-case traffic loads
SENSITIVITY ANALYSIS (“OPERATIONS” TRAFFIC) Sensitivity to the number of IEDs Sensitivity to the number of PMUs Sensitivity to the rural cell area (Total traffic) Sensitivity to the number of substations in the cell coverage area
COVERAGE-LIMITED LTE CELL, 700 MHz10MHz-WIDE CHANNEL CCTV Metering + Demand Response Fraction of LTE Cell Capacity Used by Utility Apps Synchrophasor +Substn Voice & Data Mobile WorkforceVoice & Data Critical SCADA
TRAFFIC IN 700MHz LTE MACROCELL% OF AVAILABLE CAPACITY, 10 MHz-WIDE CHANNEL
REQUIRED CELL SITESIMPACT OF SPECTRUM BAND HigherBands HigherOpEx&CapEx 1x ~2x ~10x 450 MHz 700 MHz 1800 MHz
CONCLUSION • Quantified traffic generated by smart grid applications, traffic carried at aggregation points • Critical data for network planning, design • Quantified amount of broadband spectrum needed by LTE Field Area Networks in different bands • Small amount of non-preemptible capacity required for critical operations traffic • ~5% of cell capacity (worst-case) in 10 MHz cell • Methodology easily extended to other scenarios (bands, input parameters)