Download
1 / 37
370 likes | 557 Views
Mid-Range Streamflow Forecasts for Water Supply Management in the Puget Sound Region. Matthew Wiley Richard Palmer October 26, 2005. Water Resources Management and Drought Planning Group The Climate Impacts Group PRISM, Puget Sound Regional Synthesis Model.

E N D
Mid-Range Streamflow Forecasts for Water Supply Management in the Puget Sound Region Matthew Wiley Richard Palmer October 26, 2005
Water Resources Management and Drought Planning Group • The Climate Impacts Group • PRISM, Puget Sound Regional Synthesis Model
Partner Utilities: Central Puget Sound Water Supplier’s Forum Seattle Public Utilities Tacoma Water Everett Public Utilities
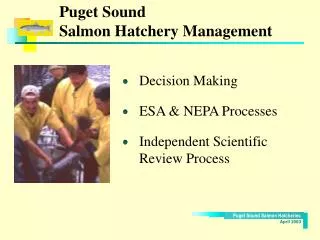
Outline • Forecast Method and Locations • Some Past Results • What lies ahead…. • New forecast products in the works
Mid-Range Forecasts for Utilities in the Puget Sound • Using DHSVM • 1-9 month lead time forecasts of streamflows • For Puget Sound area water supply systems. • Forecasts are based on: • Current watershed conditions • ENSO state conditioned ESP simulations • CPC’s long-lead seasonal forecast.
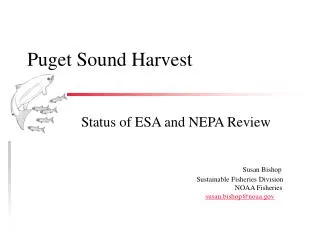
Sultan River • Snohomish PUD Hydropower project • Everett Water Supply • S.F. Tolt River • Seattle Water Supply • Cedar River • Seattle Water Supply • Green River • Flood Control • Tacoma Water Supply • All have some degree of instream flow requirements for salmon habitat preservation
Last Spring’s Forecast March 2005 Forecast: Cedar River, above Chester Morse Reservoir
12.3" Conclusions from March 2005 Forecast Meeting: • A 10% reduction in consumption reduces probability to around 5% chance of shortfall • Current snowpack is only half of the picture, spring rains can also refill reservoirs. • 10-12 inches* (at Seatac) between March 1 and July 1 will get us to near average storage by September 1 *(Average precip is 9.5 inches)
Retrospective: September04, Cedar River above Chester Morse • 9 month lead: May forecast for a little below average
Retrospective: October04, Cedar River above Chester Morse • 8 month lead: May forecast for a little below average
Retrospective: November04, Cedar River above Chester Morse • 7 month lead: May forecast below average, June, July average
Retrospective: December04, Cedar River above Chester Morse • 6 month lead: May forecast furthur below average, June, July average
Retrospective: January05, Cedar River above Chester Morse • 5 month lead: May and June forecast below average, July average
Retrospective: February05, Cedar River above Chester Morse • 4 month lead: May, June, July forecast below average
Retrospective: March05, Cedar River above Chester Morse • 3 month lead: May, June, July forecast below average
Retrospective: April05, Cedar River above Chester Morse • 2 month lead: May, June, July forecast below average
Retrospective: May05, Cedar River above Chester Morse • 1 month lead: May, June, July forecast below average
Retrospective: June05, Cedar River above Chester Morse • 0 month lead: Model hits flows well when given observed weather
Predicting Spring flows • Benefit of climate information over full historic range is apparent immediately. • Accuracy continues to improve as lead time decreases
Retrospective: July05, Cedar River above Chester Morse • Start looking to fall…
Retrospective: August05, Cedar River above Chester Morse • Start looking to fall…
Retrospective: September05, Cedar River above Chester Morse • Start looking to fall…
2005 Fall Forecast • Less dependant on initial conditions than Spring forecast. • Monthly updates to ESP traces adds little additional knowledge. • Updates to initial conditions very important for Winter/Spring. • Forecasts improve as lead time decreases • What are current forecast indications…
IRI - ENSO forecast • Very high probability of neutral conditions continuing for several months. • Streamflow forecast system set to uses ENSO neutral years only (42 traces)
CPC • Elevated probability of above average temperatures for next 10 months • Precipitation • EC for the next five months, • Elevated chance of above average precipitation starting in May and lasting for the Spring months, • Returning to equal changes for the coming Summer. • Seems to always have above average temperature!
Mid-range Forecasts for Utilities in the Puget Sound • http://www.cses.washington.edu/cig/ • http://www.tag.washington.edu/projects/midrange.html • Web based delivery and e-mail distribution of pdf summary
Mid-range Forecasts for Utilities in the Puget Sound • Graphic and tabular forecasts of streamflows into the water supply reservoirs on the Cedar, S.F. Tolt, Sultan and Green Rivers Probability of not exceeding given historic flow thresholds MONTH min 25th 50th 75th max 05/2005 0.69 1.00 1.00 1.00 1.00 06/2005 0.16 0.94 1.00 1.00 1.00 07/2005 0.16 0.72 0.90 0.99 1.00 08/2005 0.00 0.29 0.59 0.87 1.00 09/2005 0.00 0.10 0.26 0.61 1.00 10/2005 0.00 0.09 0.30 0.69 0.99 Ensemble predicted flows (cfs) at specified percentiles MONTH 1% 5% 10% 20% 30% 40% 50% 60% 70% 80% 90% 95% 99% 05/2005 75 98 101 119 128 144 150 159 171 193 215 247 290 06/2005 48 55 58 70 88 102 114 129 150 177 203 225 271 07/2005 35 38 44 48 56 61 65 72 77 93 109 129 206 08/2005 31 35 36 38 41 44 47 50 52 64 75 95 115 09/2005 35 39 39 44 55 63 72 83 92 122 175 187 313 10/2005 33 51 80 103 124 168 182 203 234 259 328 345 411
Additional Forecast Information and Products • Current conditions, summary of most recent month, and year to date at SeaTac and Paine Field Average Temperature at SEATAC for 09 / 2005 59.549 Average 09 temp at SEATAC 60.42488 Departure from norm -.87588 This is the 34 warmest (22 coldest) instance of month 09 in the record from 1950 to 2004 Total Precipitation at SEATAC for 09 / 2005 0.67992 inches Average 09 precipitation at SEATAC 1.706625 inches Departure from norm -1.02670 This is the 13 driest (43 wettest) instance of month 09 in the record from 1950 to 2004
Additional Forecast Information and Products • Probabilistic climate forecasts at weather stations used in hydrologic simulations (16 stations)
Additional Forecast Information and Products • Simulated “current conditions” in areas without monitoring information • Probabilistic snow state forecasts • At monitored locations (SNOTEL) • And unmonitored (FAUXTEL)
Experimenting with Dynamic Data Layer within Google Earth • Free downloadable Earth browser • We area producing Puget Sound Water Resources Forecast data overlay • Linked to updateable database of forecast information
Mid-Range Streamflow Forecasts for Water Supply Management in the Puget Sound Region Matthew Wiley Richard Palmer October 26, 2005