Download
1 / 12
120 likes | 148 Views
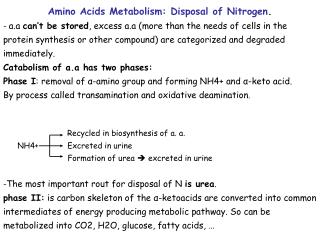
Explore a numerical simulation model based on research by ter Schure, examining key state variables and parameters in yeast nitrogen metabolism. Compare trends and insights with the original study, offering a comprehensive overview and future research directions.

E N D
Nitrogen Metabolism of Saccharomyce cervisiae A Matlab numerical simulation based on the research of ter Schure published in the Journal of Bacteriology and Microbiology Sarah Carratt BIOL 398/MATH 388 Loyola Marymount University February 24, 2011
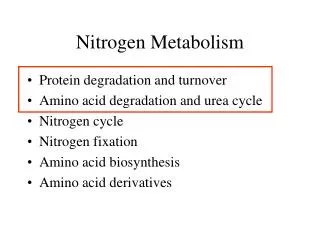
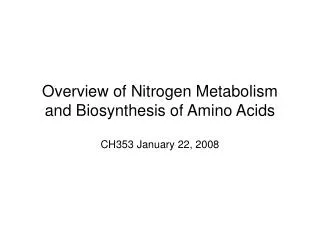
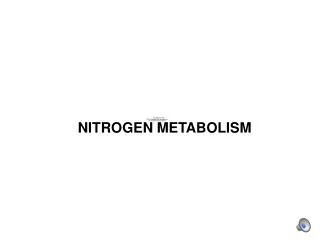
Overview Context and purpose for model State variables Parameters Terms for Equations How do they fit context? Differential Equations Simulation graphs (D=.05, .29) Trends Brief comparison with ter Schure studies
Context and Purpose The System = The Cell • Model shows change over time as related to state variables. • By changing the parameters, starting concentrations, ect., my model allows observation of consequent changes in cell
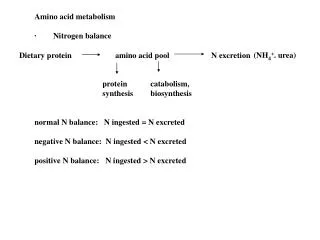
State Variables • factors to watch/model as they change over time • Ammonium → nitrogen • α-ketoglutarate • Glutamate • Glutamine
Parameters • V#= indirect measure of enzyme level (ke) • GDA, GS, NAD-GDH, NADPH-GDH • k#= rate constant for each enzyme • Du = source, inflow (dilution rate*feed concentration) • u = nitrogen + carbon • D = 1/time
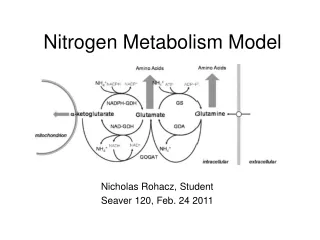
Understanding the Math V5, k5 V5, k5 V3, k3 V1, k1 V5, k5 V5, k5 V2, k2 V4, k4 • Adding/subtracting these terms in differential equation can show production/consumption of product
Differential Equations dxdt(keto) = V3(mate/(k3+mate))-V4(keto/(k4+keto)) dxdt(mine) = V2(mate/(k2+mate))-V1(mine/(k1+mine)) dxdt(mate) = V1(mine/(k1+mine))-V2(mate*NH4/(k2+mate*NH4))+V3(keto*NH4/(k3+keto*NH4))-V4(mate/(k4+mate))+V5(keto*mine/(k5+keto*mine)) dxdt(NH4) = D*u+V1(mine/(k1+mine))+V3(mate/(k3+mate))-V2(NH4/(k2+NH4))-V4(NH4/(k4+NH4))
K values= 2 V values = 5 u = 10 t = 0-10 x0 = 10 or 20 Simulation at Microbiology Dilution Rates FUTURE: Expand model to provide better comparison between dilution rates and alter other variables/parameters in equations
Overview of Model • “Ends” of process were mostly constant (-ketoglutarate and glutamine) • Glutamate is positive and linear • Place in metabolism/Pathways that produce glutamate in cycle • Ammonium is mostly constant • Slight loss initially followed by low growth in .29 (positive trend) • Steeper loss initially followed by low loss in .05 (negative trend) • FUTURE • Expand model to provide better comparison between dilution rates • Alter other variables/parameters in equations
Comparision with ter Schure Papers • Microbiology paper helped to clarify methods of Bacteriology paper • My model shows interaction of substrates ter Schure measured
Review • Model shows how state variables/substrates change over time. • State variables: • Ammonium → nitrogen, α-ketoglutarate, Glutamate, Glutamine • Parameters: • V, k, D, u • Assigned constants to reactions and +/- in equation shows production/consumption • Simulation graphs (D=.05, .29) • Trends: • Middle vs. Ends • The goal was to examine the interaction of substrates in nitrogen metabolism proposed by ter Schure studies accomplished?
References Nitrogen-regulated transcription and enzyme activities in continuous cultures of Saccharomyces cerevisia (Microbiology, 1995, 141, pp1101-1108) The Concentration of Ammonia Regulates Nitrogen Metabolism in Saccharomyces cerevisiae (Bacteriology, 1995, 177, no. 22, pp6672-6675) Images from class presentations by Dr. Dahlquist and Dr. Fitzpatrick