Download
1 / 55
550 likes | 683 Views
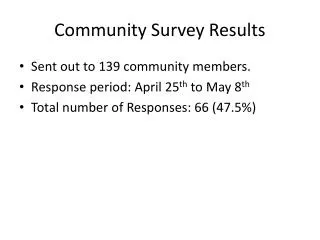
Wellbeing in Kings County Results from the GPI Community Survey. Mike Pennock Martha Pennock Ron Colman. Majority of residents are satisfied with their lives…. % who are very satisfied. Life-satisfaction……. Increases with income (probably levels off in upper income)

E N D
Wellbeing in Kings CountyResults from the GPI Community Survey Mike Pennock Martha Pennock Ron Colman
Life-satisfaction……. • Increases with income (probably levels off in upper income) • Highest among retirees and homemakers • Mid-range for employed persons and students • Lowest among unemployed
Values and Life-Satisfaction • Positive social values associated with life-satisfaction • Materialistic values were not • Consistent with literature
Spirituality • 60%- spiritual values played an important role • Higher in females (65%) than males (55%) • Increases with age from 37% among youngest to 79% among over 65
Unemployment • 12.7% higher than corresponding NS and can rates • Highest among youngest (42%). Lowest among 35-44 (8.5%)
Unemployed • 52% of unemployed were long-term (25 weeks+) • 16% were pessimistic about finding work • Both higher among males
Part-time • 15% working part-time • Higher in females (22%) than males (8%) • 15% of part-timers are involuntary • Higher among females (17%) than males (9%)
Self-rated Health • 52% excellent or very good • 18% poor or fair • No gender differences • Health declined with age • Increased with income
Smoking • 17% daily smokers- close to nat’l average and slightly lower than NS rate • No gender differences • Highest among middle-aged (23%)) • Lowest among 55+ (10%) • Mid-range among 35 and under (15%) • Income effect- from 23% to 12%
Obesity • 23%- higher than NS (20%) and Canada (15%) • No gender differences • Highest in 25 to 34 and 45 to 64 • Lowest in 65+ • Highest in middle-income groups
Sedentary Lifestyle • 19% with no gender differences • No age effect • U-shaped curve with age (highest in low income (21%) and highest income (22%)
Physical activities at least 5X per week • 43% • Males slightly higher (45%) than females (41%) • U-shaped with age- lowest among middle-aged • No income effect (positive)
Mental Health Strong Age Effects
And emotional distress Two or more symptoms
Also, Strong income effects on all measures Gender effect on depressed mood but not others
Life Stress Somewhat or very stressful
Stressed lives • 43 % consider themselves workaholics • Only 15% planned on cutting back next year
Volunteering • 51% gave unpaid help to group or organization • Highest among 35+ • Positive relationship with income • 51% very satisfied and 41% somewhat satisfied
Informal Volunteering • Provided by 59% • Higher in females (62%) than males (56%)
Willing to do more if asked • 49% would give more time if asked • Males- 55% • Young (15 to 24) 76% • Low income (58%)
Social Support • Strong income gradient across categories • Lowest among unemployed
Crime and security • 14% of both genders had been victimized during past five years • Peaked among middle-aged and lowest among elderly • Highest (20%) in high income • Lowest (9%) in low income26% knoew someone else who had been victimized
Safety • 97% were satisfied with their sense of safety from crime • Males more likely to be “very satisfied” • 28% felt neighbourhood was very safe (44% for males) • 45% felt it was reasonably safe • Females more likely to not walk alone at night 22% vs 15%