Download
1 / 1
10 likes | 219 Views
Planetary Boundary-layer Ozone Flux using Ozone DIAL and Compact Wind Aerosol Lidar (CWAL) in Huntsville AL. Guanyu Huang 1 , Michael J. Newchurch 1 , Shi Kuang 1 , Kevin Knupp 1 , Lihua Wang 1 , Wesley Cantrell 1 1.University of Alabama in Huntsville. 1’’ receiver (Ch-0) 100m-1km.

E N D
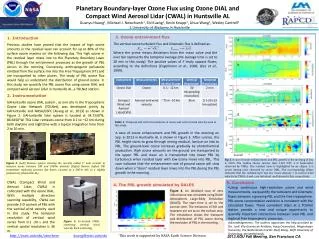
Planetary Boundary-layer Ozone Flux using Ozone DIAL and Compact Wind Aerosol Lidar (CWAL) in Huntsville AL Guanyu Huang1, Michael J. Newchurch1, Shi Kuang1, Kevin Knupp1, Lihua Wang1, Wesley Cantrell1 1.University of Alabama in Huntsville 1’’ receiver (Ch-0) 100m-1km 16’’ receiver (Ch-5) 3-12km Introduction Previous studies have proved that the impact of high ozone amounts in the residual layer can account for up to 80% of the surface ozone maxima on the following day. This high ozone in the residual layer mixes into to the Planetary Boundary Layer (PBL) through the entrainment processes as the growth of PBL occurs in the morning. Conversely, anthropogenic pollutants emitted from the surface mix into the Free Troposphere (FT) and are transported to other places. The study of PBL ozone flux would help us understand the distribution of ground ozone. In this study, we quantify the PBL ozone flux using ozone DIAL and compact wind aerosol Lidar in Huntsville AL, a TOLNet station. Instrumentation UAHuntsville ozone DIAL system , as one site in the Tropospheric Ozone Lidar Network (TOLNet), was developed jointly by UAHuntsville and NASA/GSFC [Kuang et al., 2013] as shown in Figure 2. UAHuntsville lidar system is located at 34.7250°N, 86.6450°W. This Lidar retrieves ozone from 0.1 to ~12 km during both daytime and nighttime with a typical integration time from 2 to 10 min. 3. Ozone entrainment flux a 4’’ receiver (Ch-1 and Ch-2) 500m-1.5km, 1-5km Laser outgoing mirror The vertical ozone turbulent flux and kinematic flux is defined as: Where the prime means deviations from the mean value and the over bar represents the temporal average (the average time is set to 20 min in this study). The positive values of F imply upward fluxes, according to the definitions [Engelmann et al., 2008; Giez et al., 1999]. b c d Table 1. Temporal and vertical resolutions of ozone and vertical wind velocity used in this study. A case of ozone enhancement and PBL growth in the morning on Sep. 6, 2013 in Huntsville AL is shown in Figure 3.After sunrise, the PBL height starts to grow through mixing residual, laminar air into to PBL. The ground-level ozone increases gradually by photochemical production. High ozone amounts on the ground are transported to the upper PBL and clean air is transported into lower PBL by turbulence when residual layer with low ozone mixes into PBL. This case indicates that the enhancement rate of ground ozone will slow down when a “clean” residual layer mixes into the PBL during the PBL growth in the morning. e sunrise Fig 3. A case of ozone enhancement and PBL growth in the morning of Sep. 6, 2013. The redline shows sunrise time 1123 UTC. a is backscatter observed by CWAL. The residual layer is highlighted by an ellipse. b is ozone mixing ratio observed by ozone DIAL. The corresponding ellipse indicates that the residual layer has low ozone amount. c is vertical wind velocity by CWAL. d and c are turbulent and kinematic flux, respectively. Figure 2. (Left) Receiver system showing the recently added 1’’ mini receiver to measure ozone between 100 and 1000m altitude; (Right) Raman shifted YAG transmitter replacing previous dye lasers. Located at a 200-m ASL in a slightly polluted city (Huntsville AL). 4. The PBL growth simulated by DALES • Using continuous high-resolution ozone and wind measurements, we quantify the turbulent and kinematic fluxes between a growing PBL and the free troposphere. PBL ozone concentration evolution is consistent with the calculated fluxes. These coincident lidars at a TOLNet station provide a new and unique opportunity to quantify important interactions between local PBL and regional free tropospheric processes. • Acknowledgements: The authors appreciate the help provided by Drs. Jordi Vila-Guerau de Arellano, HuugOuwersloot,WageningenUniversity, the Netherlands and Dr. Steef Boing, Delft University of Technology, the Netherlands. CWAL (Compact Wind and Aerosol Lidar, CWAL) is collocated with the ozone DIAL. With multiple direction scanning capability, CWAL can provide 3-D context of PBL with the vertical wind velocity used in this study. The temporal resolution of vertical wind varies from 0.1 -30 s and the vertical spatial resolution is 36 m. 5. Conclusion Figure 4. An idealized case of zero initial ozone was simulated using Dutch Atmospheric Large-Eddy Simulation (DALES). The start time is set to the sunrise time. The emissions of NO and Isoprene are set to on the surface only. The simulations shows the transport and distribution of PBL ozone during the evolution of PBL in the morning. Figure 3. Co-located CWAL observing vertical wind velocity, back scattering. 2013 AGU Fall Meeting, San Francisco CA http://nsstc.uah.edu/atmchemhuang@nsstc.uah.eduThis work is supported by NASA Earth Science Division