Download
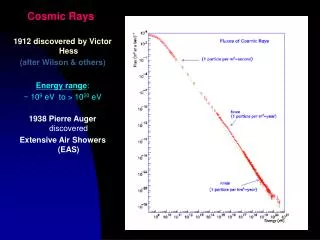
1 / 15
150 likes | 337 Views
Ground level enhancement of the solar cosmic rays on January 20, 2005. A.V. Belov (a), E.A. Eroshenko (a), H. Mavromichalaki (b), C. Plainaki(b), V.G. Yanke (a) . Institute of Terrestrial Magnetism, Ionosphere and Radio Wave Propagation RAS (IZMIRAN), 142190, Troitsk, Moscow region, RUSSIA

E N D
Ground level enhancement of the solar cosmic rays on January 20, 2005. A.V. Belov (a), E.A. Eroshenko (a), H. Mavromichalaki (b), C. Plainaki(b), V.G. Yanke (a) . • Institute of Terrestrial Magnetism, Ionosphere and Radio Wave Propagation RAS (IZMIRAN), 142190, Troitsk, Moscow region, RUSSIA • Nuclear and Particle Physics Section, Physics Department, Athens University Pan/polis-Zografos 15771 Athens, GREECE. rus-eroshenko E-abs2-SH15-poster
Abstract • Unexpectedly giant proton event toward the end of solar cycle was recorded on 20 January 2005 by the worldwide network of neutron monitors. The GLE was associated with the flare X7.1 on 20 January in AR720 (N12 W58) started at 6:36 UT and occurred on the background of relatively quiet geomagnetic activity. The flux of the first relativistic protons reached Earth at 6:50 UT by very narrow beam and had a very hard spectrum. The peak of the CR variations reached several thousands of percentages at southern polar stations. • The characteristics of the cosmic ray energy spectrum, anisotropy, differential and integral fluxes as well, were obtained by the data from about 40 neutron monitors using anisotropic and compound models of solar cosmic ray variations.
One of the greatest GLE Fig. 1. Relative count rate variations at some neutron monitors during the greatest GLEs.
Large and long anisotropy in GLE69 Fig.3. GLE 69 as observed on subpolar NMs McMurdo and Thule.At the first 40 minutes the great anisotropy is evident, but in fact the enhancement atMcMurdosignificantly exceeds that at Thuleeven in 10 hrs after the onset. Fig. 2. The visual anisotropy in CR variations at four NMs: CAPS-Cape Shmidt, MCMD-McMurdo, NAIN, THUL-Thule.
Data and Method: GLE model Solar Cosmic Ray Variations : where are the coupling coefficients axis-symmetric anisotropy function Variations of the solar CR flux Consequently: Contribution of the isotropic part of the SCR spectrum Contribution of the anisotropic part of the SCR spectrum
Energy spectrum changes The first particles came from the Sun by the narrow beam and had very hard spectrum with an index -0.65.In some minutes after the onset a spectrum of the solar CR jumped to become soft and during the next 5 hours its index changed only within the -3.0 - 4.0 range. In the first 5-minute interval high energy particles dominated in the flux whereas just before the 7:00 UT the number of low energy particles essentially enhanced. Fig.4. Spectra of the solar CR during the first and second 5-minute intervals after the onset.
Mean Flux and Energy Spectrum Fig. 5. Behavior of the power law energy spectrum index together with the mean (averaged by the all directions) particle flux with 1 GeV energy..
Upper Proton Energy Only in the first minutes the model selects sufficiently high upper energy, after this the modeling Eu is small and underestimated. On the other side, it is a real reflection of the small contribution of the high energy particles (>3GeV) in the observed GLE. Fig. 6. Behavior of the upper energy Eu, obtained by model (circles) and observed by neutron monitors (triangles).
Maximal, Minimal and Mean Fluxes Fig. 7. Behavior of the minimal, maximal and mean fluxes of solar CR with 1 GeV energy. Anisotropy decreases quickly at the first time, but it remains sufficiently noticeable during many hours after the onset. .
Differential Fluxes Fig. 8. Behavior of differential fluxes of solar cosmic rays with different energies. Simultaneous maximum in broad energy range testifies the arrival of all energies at the same time in the first minutes.
Integral Fluxes Fig. 9. Integral fluxes of solar CR of different energies obtained from the NM data using the GLE model. The fluxes of 300 and 100 MeV are the extrapolation, but there is a good agreement for maximal flux >100 MeV with the satellite observations. Fig. 10. Behavior of integral fluxes of solar protons with different energiesby the satellite observations (GOES measurement). 20 January 2005, UT
Anisotropy and source location Fig.12. Behavior of latitude and longitude of maximum solar particle flux. Fig.11. Behavior of the solar CR anisotropy magnitude and coefficient n, characterizing a width of angular distribution of anisotropic flux. .
Angular distribution Fig. 13. Angular distributions at 3 first 5-min intervals and half an hour later.
Longitudinal distribution Fig. 14. Longitudinal distributions in 3 first intervals and on the late phase of GLE in geographic coordinates. At the beginning the beam is very narrow and then quickly widens. Later the anisotropy changes by a complicated way.In a whole the wide angular distribution is characteristic for the late phase, but model selects sufficiently often also a narrow beam even in 8-9 hours after the onset
Conclusions • The record enhancement in the counting rate at some southern polar NMs on 20 January 2005 ranges this event among the greatest GLEs. Nevertheless, high energy particles (>3 GeV) turned out to be of much less amount than in 1956 and 1989 events. • The first particles came by very narrow beam and had a very hard spectrum. Already in some minutes after the onset the spectrum became soft and kept its form during the several hours with index -3.0-4.0. • The solar CR flux was anisotropic not less than 11 hours. The changes of anisotropy parameters along the time seems to be related to the variability of the interplanetary magnetic field. • It is possible and necessary to improve the obtained results.