Download
1 / 28
280 likes | 421 Views
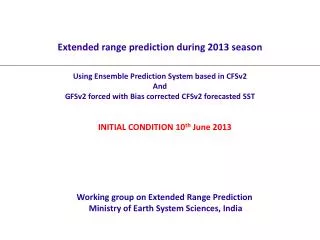
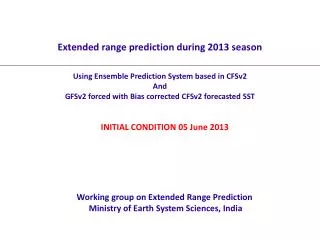
Extended range prediction during 2013 season Using Ensemble Prediction System based in CFSv2 And GFSv2 forced with Bias corrected CFSv2 forecasted SST. INITIAL CONDITION 05 June 2013. Working group on Extended Range Prediction Ministry of Earth System Sciences, India.

E N D
Extended range prediction during 2013 season Using Ensemble Prediction System based in CFSv2 And GFSv2 forced with Bias corrected CFSv2 forecasted SST INITIAL CONDITION 05 June 2013 Working group on Extended Range Prediction Ministry of Earth System Sciences, India
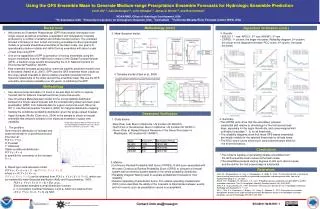
Strategy: Ensemble Prediction using CFS/GFSv2 (T126) • Ocean and Atmospheric Initial conditions (IC) are obtained from NCEP. • Technique was developed to perturb ICs to generate 11 members. (Abhilash et al., 2013) • Model has been integrated for 45 days for each 11 ICs at five day intervals starting from 16th May (Eg: 16May, 21May, 26May, 31May, 05Jun........etc). Climatology has been calculated from 10-year hindcast. • Bias correction in daily forecasted SST from CFSv2 for each lead time has been done by removing the daily mean bias for corresponding lead time (model climatology-observed climatology) from forecasted daily SST. (Sahai et al., 2013; Abhilash et al., 2013)
FORECAST FROM CFSv2(T126) And Bias Corrected GFS2(T126) Based on IC 05 June 2013
Daily evolution of rainfall and wind at 850hPa CFS forecast based on IC=05 June 2013
Daily evolution of rainfall and wind at 850hPa GFS forecast forced with bias corrected CFS forecasted SST based on IC=05 June 2013
Daily evolution of vorticity at 850hPa CFS forecast based on IC=05 June 2013
Daily evolution of vorticity at 850hPa GFS forecast forced with bias corrected CFS forecasted SST based on IC=05 June 2013
CFS forecast based on IC=05 June 2013 Actual Anomaly
GFSbc forecast based on IC=05 June 2013 Actual Anomaly
CFS-GFSbc Forecast Over Homogenous Regions MZI, CEI, NEI, NWI & SPI
Inferences from the present analysis • The low level cross-equatorial flow has strengthened both in CFSv2 and GFSbc. Both CFSv2 and GFSbc show that rainfall over monsoon zone of India (MZI) would start to intensify from 13th Jun onwards. This intensification of rainfall is likely due to the formation of a system over BOB. • Monsoon trough would be over MZI around 13th Jun both in CFSv2 and GFSbc. • CFSv2 indicates rainfall over west coast during P1 (6-10 Jun) and over west coast and MZI during P2 (11-15June), P3( 16-20 Jun) and P4 (21-25Jun). Positive anomalies are seen over west coast and MZI during P2 (11-15 June). • GFSbc indicates rainfall over west coast during P1 (6-10 Jun); over west coast and MZI during P2 (11-15June), P3( 16-20 Jun) and over west coast and part of north-west India and north-east India during P4 (21-25Jun). Positive anomalies are seen over west coast and MZI during P2 (11-15 June).
Inferences from the present analysis • CFSv2 shows the above normal condition over MZI (during P1-P4), CEI (during P1, P2 and P4), NWI (during P2 and P3) and SPI (during P1, P2 and P4). Near normal conditions are seen over CEI (during P3), NEI (during P1-P3), NWI (during P4). Below normal conditions are seen over NEI (during P4), NWI (during P1) and SPI (during P3). • GFSbc shows the above normal condition over MZI (during P1 and P2), CEI (during P1, P2 and P4), NWI (during P2 and P4) and SPI (during P1 and P3). Near normal conditions are seen over MZI (during P3 and P4), CEI (during P3), NEI (during P1-P4) and NWI (during P3). Below normal conditions are seen over NWI (during P1) and SPI (during P2 and P4).
Inferences from the present analysis • Real time forecast for MISO shows that fresh evolution of MISO is eminent with a prominent northward propagation from both CFSv2 and GFSbc. • However GFSbc shows stronger amplitude than that in CFSv2.
CFS-GFSbc Forecast Verification Over Homogenous Regions MZI, CEI, NEI, NWI & SPI
MISO F/C verification For 16May IC (OBS is for 20 days only) For 21May IC (OBS is for 15 days only)