Download
1 / 19
190 likes | 326 Views
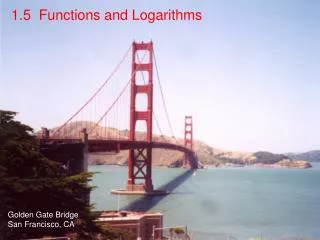
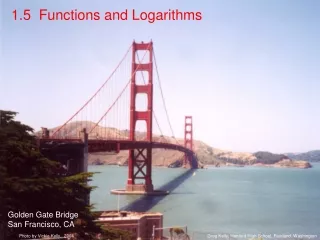
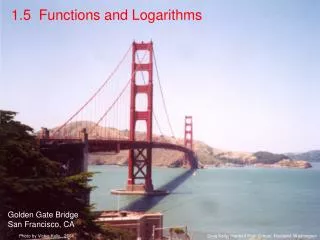
1.5 Functions and Logarithms. Golden Gate Bridge San Francisco, CA. Photo by Vickie Kelly, 2004. Greg Kelly, Hanford High School, Richland, Washington. In other words, a function is one-to-one on domain D if:. whenever. A relation is a function if:

E N D
1.5 Functions and Logarithms Golden Gate Bridge San Francisco, CA Photo by Vickie Kelly, 2004 Greg Kelly, Hanford High School, Richland, Washington
In other words, a function is one-to-one on domain D if: whenever A relation is a function if: for each x there is one and only one y. A relation is a one-to-one if also: for each y there is one and only one x.
To be one-to-one, a function must pass the horizontal line test as well as the vertical line test. one-to-one not one-to-one not a function (also not one-to-one)
Inverse functions: Given an x value, we can find a y value. Solve for x: Inverse functions are reflections about y = x. Switch x and y: (eff inverse of x)
WINDOW GRAPH a parametrically: Y= example 3: Graph: for
b Find the inverse function: WINDOW Y= > GRAPH example 3: Graph: for Switch x & y: Change the graphing mode to function.
is called the natural log function. is called the common log function. Consider This is a one-to-one function, therefore it has an inverse. The inverse is called a logarithm function. Two raised to what power is 16? Example: The most commonly used bases for logs are 10: and e:
In calculus we will use natural logs exclusively. We have to use natural logs: Common logs will not work. is called the natural log function. is called the common log function.
7 Here is a useful keyboard shortcut for the newer TI-89 Titanium calculators. (Unfortunately the shortcut does not work on the older TI-89s.) returns: If you enter: you get: If you enter: you get: Even though we will be using natural logs in calculus, you may still need to find logs with other bases occasionally. (base 10) (base 2)
9 returns: If you enter: you get: If you enter: you get: And while we are on the topic of TI-89 Titanium keyboard shortcuts: (square root) (fifth root)
Properties of Logarithms Since logs and exponentiation are inverse functions, they “un-do” each other. Product rule: Quotient rule: Power rule: Change of base formula:
Example 6: $1000 is invested at 5.25 % interest compounded annually. How long will it take to reach $2500? We use logs when we have an unknown exponent. 17.9 years In real life you would have to wait 18 years. p*
Indonesian Oil Production (million barrels per year): Example 7: Use the natural logarithm regression equation to estimate oil production in 1982 and 2000. How do we know that a logarithmic equation is appropriate? In real life, we would need more points or past experience.
ENTER ENTER STO Indonesian Oil Production: 20.56 million 42.10 70.10 60 70 90 60,70,90 2nd { 2nd } alpha L 1 6 3 5 alpha L 1 , alpha L 2 2nd MATH LnReg The calculator should return: Statistics Regressions Done
ENTER ENTER 6 3 5 alpha L 1 , alpha L 2 2nd MATH LnReg The calculator should return: Statistics Regressions Done 6 8 2nd MATH Statistics ShowStat The calculator gives you an equation and constants:
WINDOW ENTER ENTER Y= We can use the calculator to plot the new curve along with the original points: x y1=regeq(x) ) regeq 2nd VAR-LINK Plot 1
WINDOW GRAPH ENTER ENTER Plot 1
WINDOW GRAPH
F3 ENTER ENTER Trace What does this equation predict for oil production in 1982 and 2000? This lets us see values for the distinct points. This lets us trace along the line. 82 Enters an x-value of 82. Moves to the line. In 1982, production was 59 million barrels. 100 Enters an x-value of 100. p In 2000, production was 84 million barrels.