Slide Note
0 likes | 5 Views
The analysis focuses on the potential "gating" of forward adjustment factors (FAF) to provide certainty around capital requirements during high price events in the ERCOT market. By considering real-time FAF values and historical trends, the study explores the implications of setting maximum and minimum FAF values. Suggestions include incorporating max values for clarity on collateral requirements and maintaining a min value below 1.0 only if lookback values change. The findings underline the importance of adjusting FAF dynamics to mitigate risks and ensure market stability.

E N D
Analysis of Forward Adjustment Factors Brenden Sager, Austin Energy, Chair 18 April 2024 1
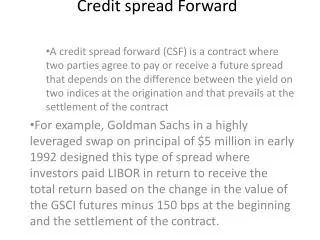
Purpose Purpose • ERCOT Credit Estimate Aggregate Liability presentations included discussions on possible “gating” of forward adjustment factors • Max values could provide certainty around capital requirements during high price events • Minimum value could provide credit assurance when FAF “haircuts” invoice exposure at values < 1.0, especially after high pricing events • However, FAF’s below < 1 are the only protection against persistent high collateral requirements from lookbacks unaligned with pricing and invoices • To date, analysis focused on EAL/TPE in various scenarios versus aggregate invoice exposure • Need to consider collateral posting which also includes discretionary collateral and CRR locks – might be hard to back out these effects
FAF definition FAF definition • Simplified formula: RFAF x Max 40-day RT invoice history • Analysis focuses on Real Time FAF’s since both RFAF and DFAF highly correlated (coefficient = 0.87) • RFAF more prominent in EAL calculation, applied to max value of Real Time daily history (lookback) • Fixing max/min values for FAF more straightforward implementation compared EAL adjustment proposals (which are not mutually exclusive)
FAF Data Summary FAF Data Summary min 0.01 2/7/2018 max 10.61 4/9/2024 N 2254 2500 FAF Distribution 2000 700 600 1500 500 1000 400 500 300 0 200 0 2 4 6 8 10 12 100 0
More Data Summary More Data Summary • FAF rising by roughly .073 per year • 45% of data between 1.0 and 1.5; 31% below 1.0 • Volatility increasing annually • Higher and more frequent pricing events in data midpoint starting in 2021 • 10 RFAF’s > 4.0 (98thpercentile) before 2021 and 34 after • Uri had highest RFAF at 10.61
RFAF Percentiles and Max Value RFAF Percentiles and Max Value FAF 2 2.5 3.25 5.25 obs > 117 45 11 4 N-tile 0.90 0.95 0.97 0.99 Wgt Avg > FAF level 4.215 5.425 5.819 8.119 • CFSG members proposed including max value for RFAF to provide more certainty around maximum collateral requirements during pricing events • ERCOT uses percentile and distributional analytic methods for other operational needs in protocols • Above method uses a weighted average of values greater than FAF at observed n-tile • For instance, at 99thpercentile only 21/2254 observations = RFAF of 5.25 • Observation weighted average of the values > 5.25 = 8.119, only four obs > than this (max 10.61)
RFAF time series and periods where < 1.0 RFAF time series and periods where < 1.0 7
RFAF history and minimums RFAF history and minimums • We observed that RFAF can fall below 1.0 and usually does so after a dramatic high price event, 31% of data < 1.0 • As high prices roll off but settlement prices remain high, calculation may cause (unintended?) FAF of < 1.0 • Given nature of calc this effectively haircuts the maximum invoice exposure, possibly below actual which is a risk to the market and undermines intent of methodology • Uri a particularly notable case where RFAF went from 10.61 to 0.44 in eight days then remained at 0.01 for several days thereafter Uri RFAF 12.00 10.00 8.00 6.00 4.00 2.00 0.00 8
RFAF history and invoice history RFAF history and invoice history • Protocols propose a Look-back period for RTM seeking max invoice exposure for 40 days ensure there is enough collateral from CP to cover default and mass transition event • While FAF method calls more collateral when forwards rise against most recent SPP’s – lookbacks maintain elevated collateral levels well past an event (40 days posting max invoice vs 2-day event) • As shown below, FAF < 1.0 effectively adjusts down the lookback to a “reasonable” amount • Can we calibrate lookback/min FAF? … Max (current RTLE, FAF adjusted RTLE) Look-back period for RTM to find the maximum of RTLE or URTA for all QSEs represented by the Counter-Party if any of the QSEs represented by the Counter-Party represent either Load or generation. 40 lrq Days Days lrq Price MW Hours Dollars FAF RTLE $ 40 2500 16 $ 1,600,000 1 $ 1,600,000 $ 5,000 5000 16 $ 400,000,000 0.01 $ 4,000,000 9
Conclusion Conclusion • CFSG should consider max values of 8.5 for FAF’s • Would add clarity for short term collateral requirements • CFSG should consider a min value of FAF’s < 1 only if there are changes to the lookback value • If lookback not changed, then current method is preferable • Fixing max/min values for FAF and/or lookbacks more straightforward implementation compared complex EAL formula adjustment proposals (which are not mutually exclusive) 12